Does anyone know how to add a gap to the xy charts if there is a null value.
Can’t figure it out and connect=“false” does not do anything…

Does anyone know how to add a gap to the xy charts if there is a null value.
Can’t figure it out and connect=“false” does not do anything…
Hi!
connect property doesn’t work with XY chart (AmChart’s documentation). You can use a Serial chart to do similar graphs.
See examples in our Sampler application: https://demo.cuba-platform.com/sampler/open?screen=charts
or AmCharts demos: Chart Demos - amCharts
Also, if you still want to use XY chart you can see this configuration of a chart that shows graphs without lines:
https://demo.cuba-platform.com/sampler/open?screen=xy-dateaxis-chart
Hi,
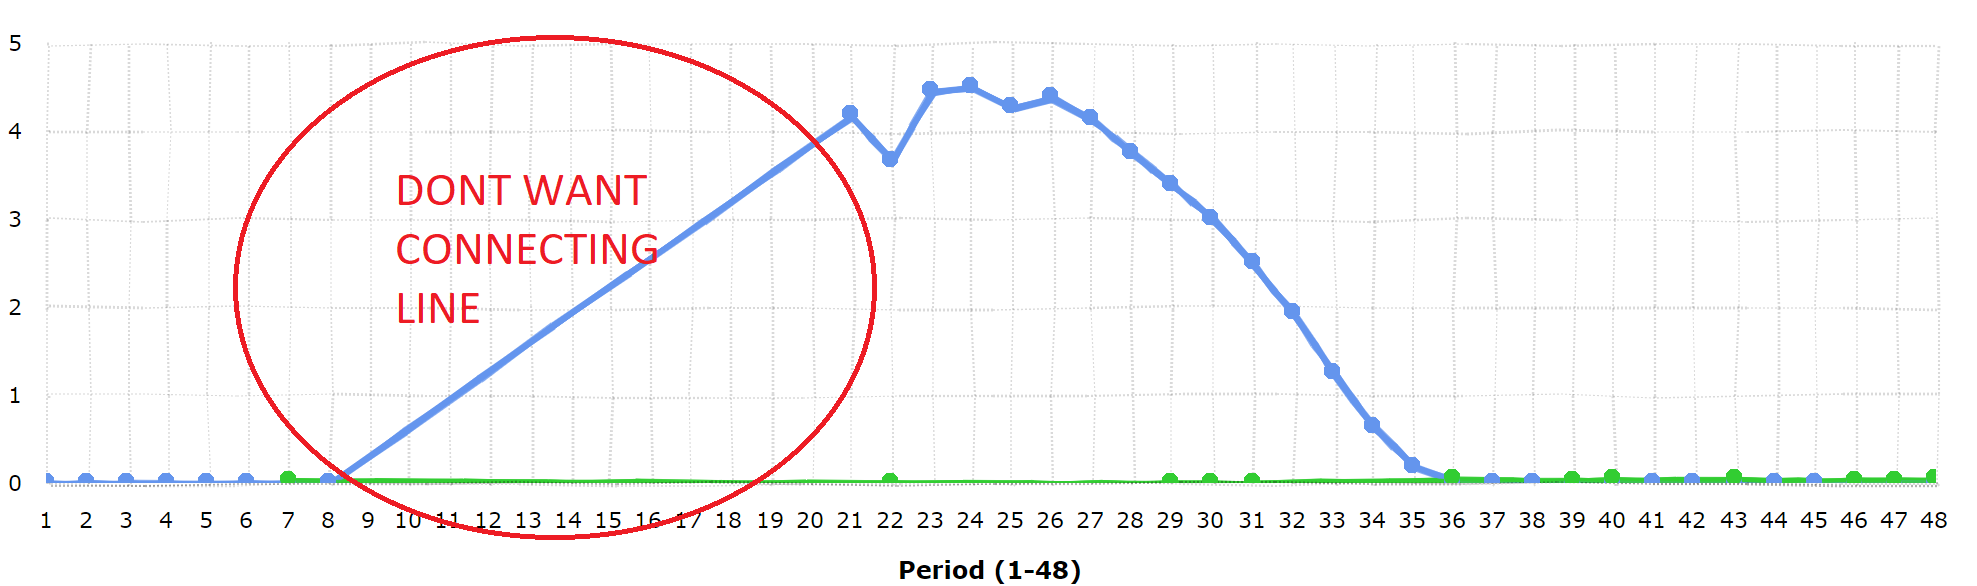
If i understand it right @daryn doesn’t want connecting lines only on gaps (period 9-21).
May passing Items with null value do the trick?*
upd: just checked. It doesn’t
There are no real examples in the cuba sampler for what I need…
I need to populate a multi line graph where the number of lines could change.
I have a view, which produces a result set like follows (I will convert this to an entity):
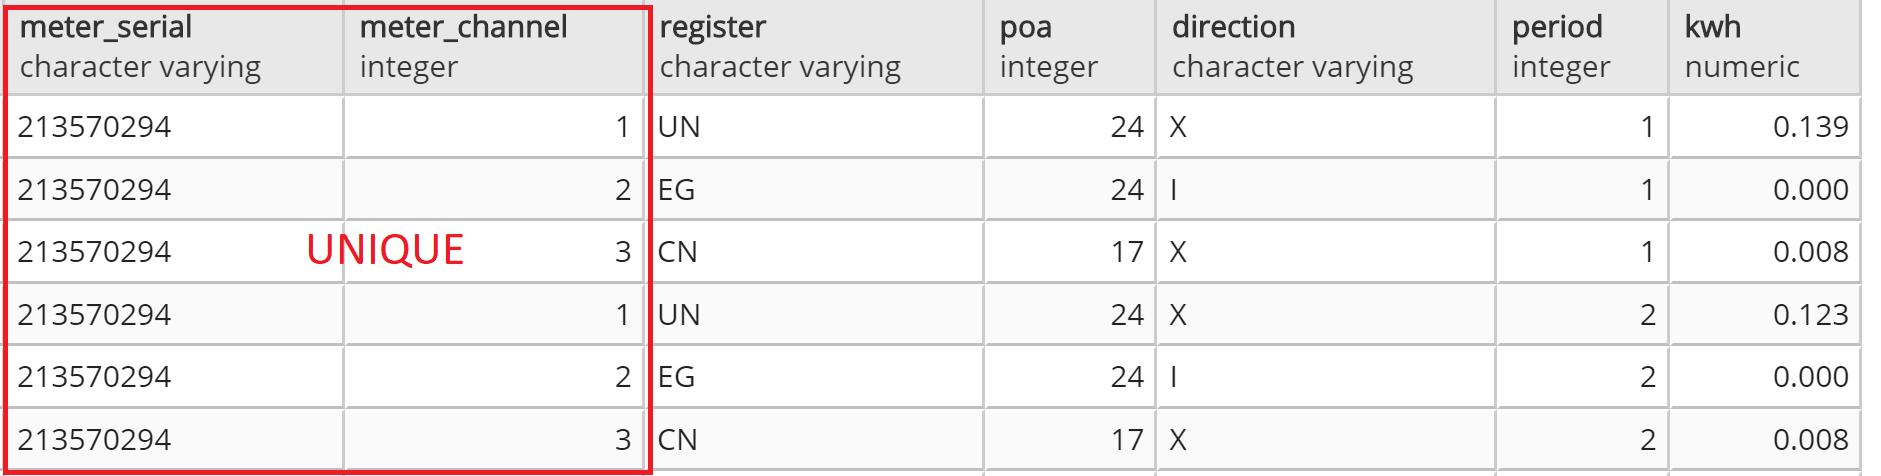
Each unique line is based off of the [meter_serial + meter_channel].
I would like the values (meter_serial, meter_channel, register, poa, direction) in the description for each line.
And possibly change the line color based off of either register or direction (or both).
The x-axis is [period]
the y-axis is [kwh]
Looking for help on suggestions for the best graph type and way to achieve the above.
The method needs to populate a varying number of graph lines based on how many combinations of meter_serial + meter_channel are returned from the query / entity list.
I have managed to do this with xychart but part of the method I used is now deprecated and I also don’t like how it joins the dots when there is missing data.
Hi,
I can suggest you to move to SerialChart.
chart.setCategoryField('period');
Graph for each of your combination (serial+channel) with datafield named unique (again - just take your combination)./* List<String> uniqueCombinations - unique combinations of serials and channels contacted together */
uniqueCombinations .forEach(this::addGraph);
/*...*/
private void addGraph(String valueField){
Graph g = new Graph();
g.setValueField(valueField);
/*
you probably want as well pass a title for your graph like '213570294 A+ T1'
anyway other configs is up to you
...
*/
chart.addGraphs(g);
}
DataProvider provider = new ListDataProvider();
readings.forEach(r -> {
    Map<String, Object> readingData = new HashMap<>();
    readingData .put('period', r.getPeriod());
    readingData .put(r.getSerial()+r.getChannel(), r.getKwh()); // Here is our valueField for graph
    provider.addItem(new MapDataItem(readingData ));
})
chart.setDataProvider(provider);
Hi Ivan,
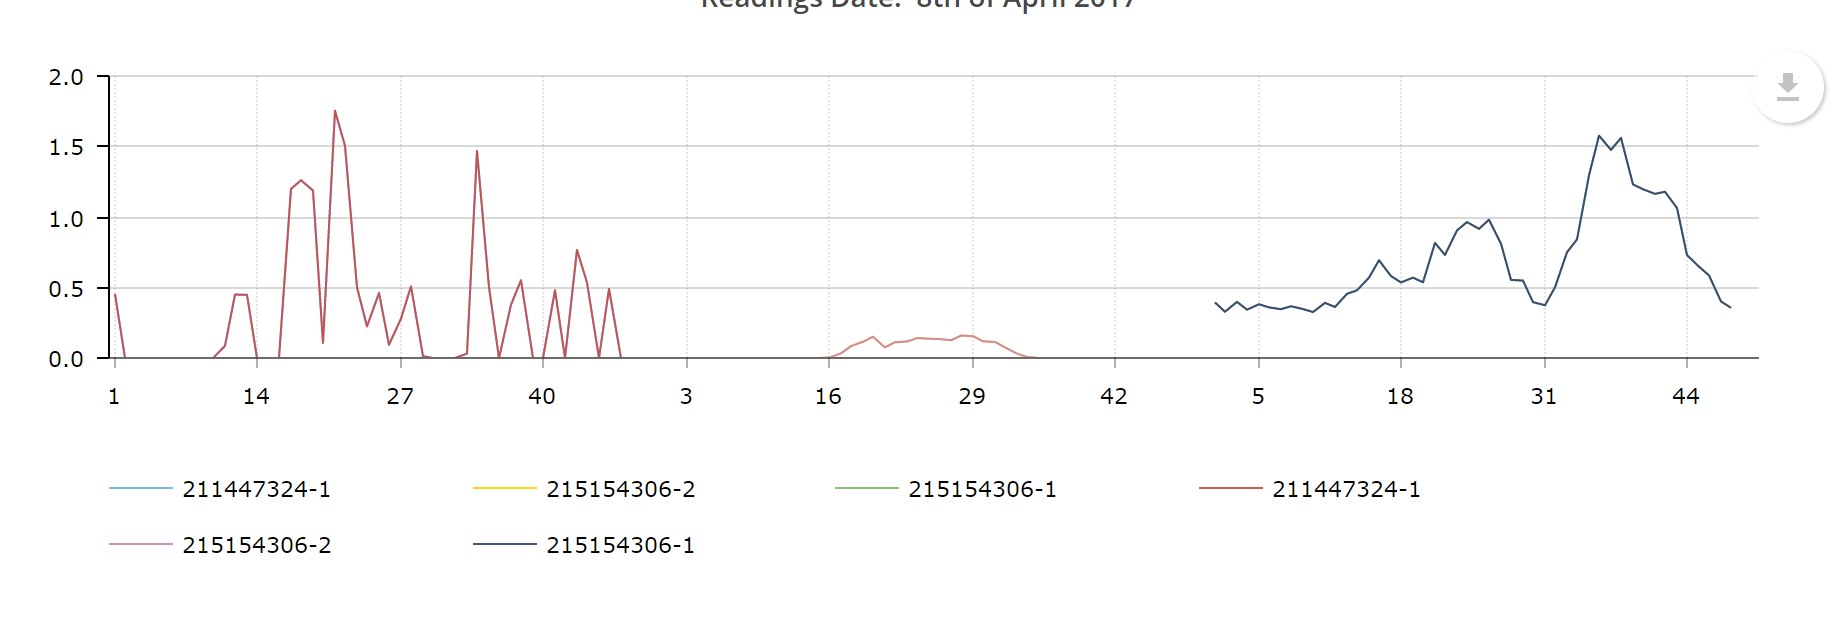
This doesn’t work. The graphs do not share the x-axis values:
The graphs are beside each other instead of on top of each other. Any other ideas?
 private void drawGraph() {


    dataProvider = new ListDataProvider();

    serialChart.setCategoryField("period");

    List<MeterChannel> channelList = meteringService.getMeterChannelsForIcpAndDate(this.getItem(), cal.getTime());

    channelList .forEach(meterChannel -> {
        System.out.println(meterChannel.getMeteringComponentSerialNumber()+meterChannel.getChannelNumber());
        addGraph(meterChannel);
        List<ChannelReadingsForDate> readings = meterReadingsService.getDoubleArrayOfAllMeterReadingsForChannelAndDate(icpIdentifierField.getValue(), meterChannel, cal.getTime());

        readings.forEach(r -> {
            Map<String, Object> readingData = new HashMap<>();
            readingData .put("period", r.getPeriod());
            readingData .put(meterChannel.getMeteringComponentSerialNumber()+"-"+meterChannel.getChannelNumber(), r.getValue()); // Here is our valueField for graph
            dataProvider.addItem(new MapDataItem(readingData ));
        });

    });

    serialChart.setDataProvider(dataProvider);
    System.out.println("Data size: "+dataProvider.getItems().size());
    serialChart.repaint();
}


public void addGraph(MeterChannel meterChannel) {
    Graph g = new Graph();
    g.setValueField(meterChannel.getMeteringComponentSerialNumber()+"-"+meterChannel.getChannelNumber());
    g.setTitle(meterChannel.getMeteringComponentSerialNumber()+"-"+meterChannel.getChannelNumber());
    serialChart.addGraphs(g);
}Hi,
I would recommend using the gapField attribute in order to provide gaps in a SerialChart. Below the example of gapField usage:
<chart:serialChart marginRight="70"
autoMarginOffset="20"
categoryField="year"
width="100%"
height="100%">
<chart:balloon cornerRadius="6"/>
<chart:valueAxes>
<chart:axis axisAlpha="0"/>
</chart:valueAxes>
<chart:graphs>
<chart:graph balloonText="[[category]]<br><b><span style='font-size:14px;'>[[value]] C</span></b>"
bullet="ROUND"
bulletSize="6"
connect="false"
lineColor="#b6d278"
lineThickness="2"
negativeLineColor="#487dac"
valueField="value"
gapField="gap"/>
</chart:graphs>
<chart:chartCursor cursorAlpha="0.1"
cursorColor="#000000"
fullWidth="true"
graphBulletSize="2"/>
<chart:chartScrollbar/>
<chart:categoryAxis minorGridEnabled="true"/>
<chart:export/>
<chart:data>
<chart:item>
<chart:property name="year" value="8" type="int"/>
<chart:property name="value" value="-0.011" type="double"/>
</chart:item>
<chart:item>
<chart:property name="year" value="9" type="int"/>
<chart:property name="value" value="-0.074" type="double"/>
</chart:item>
<chart:item>
<chart:property name="year" value="10" type="int"/>
<chart:property name="value" value="-0.124" type="double"/>
</chart:item>
<chart:item>
<chart:property name="year" value="11" type="int"/>
<chart:property name="value" value="-0.024" type="double"/>
</chart:item>
<chart:item>
<chart:property name="year" value="12" type="int"/>
<chart:property name="value" value="-0.022" type="double"/>
</chart:item>
<chart:item>
<chart:property name="year" value="13" type="int"/>
<chart:property name="value" value="0" type="double"/>
</chart:item>
<chart:item>
<chart:property name="year" value="14" type="int"/>
<chart:property name="value" value="-0.296" type="double"/>
</chart:item>
<chart:item>
<chart:property name="year" value="15" type="int"/>
<chart:property name="value" value="-0.217" type="double"/>
</chart:item>
<chart:item>
<chart:property name="year" value="16" type="int"/>
<chart:property name="value" value="-0.147" type="double"/>
<chart:property name="gap" value="true" type="boolean"/>
</chart:item>
<chart:item>
<chart:property name="year" value="21" type="int"/>
<chart:property name="value" value="-0.19" type="double"/>
</chart:item>
<chart:item>
<chart:property name="year" value="22" type="int"/>
<chart:property name="value" value="-0.056" type="double"/>
</chart:item>
<chart:item>
<chart:property name="year" value="23" type="int"/>
<chart:property name="value" value="0.077" type="double"/>
</chart:item>
<chart:item>
<chart:property name="year" value="24" type="int"/>
<chart:property name="value" value="-0.213" type="double"/>
</chart:item>
<chart:item>
<chart:property name="year" value="25" type="int"/>
<chart:property name="value" value="-0.17" type="double"/>
</chart:item>
<chart:item>
<chart:property name="year" value="26" type="int"/>
<chart:property name="value" value="-0.254" type="double"/>
</chart:item>
<chart:item>
<chart:property name="year" value="27" type="int"/>
<chart:property name="value" value="0.019" type="double"/>
</chart:item>
<chart:item>
<chart:property name="year" value="28" type="int"/>
<chart:property name="value" value="-0.063" type="double"/>
</chart:item>
</chart:data>
</chart:serialChart>
Note: the graph defines the gapField attribute and one of the data items (the one with year = 16) specifies true for gap.
Regards,
Gleb