Hello,
I have attached an example.[testDynamicChart.zip|attachment]
(upload://gE4AQ0kczQbgPnms3ksLSuyxgFX.zip) (321.1 KB)
Pinyazhin
February 28, 2020, 6:23am
#2
Hello,
it seems that there is no link to download your attached project. Please, try to reattach it.
1 Like
Pinyazhin
March 3, 2020, 7:00am
#4
Hi!
You can remove Graphs like this:
List<Graph> graphs = testChart.getGraphs();
if (CollectionUtils.isNotEmpty(graphs)) {
    graphs.clear();
}
I think you can add it to the beginning of filterData() method.
Hi, thanks for the help.
Pinyazhin
March 5, 2020, 6:29am
#6
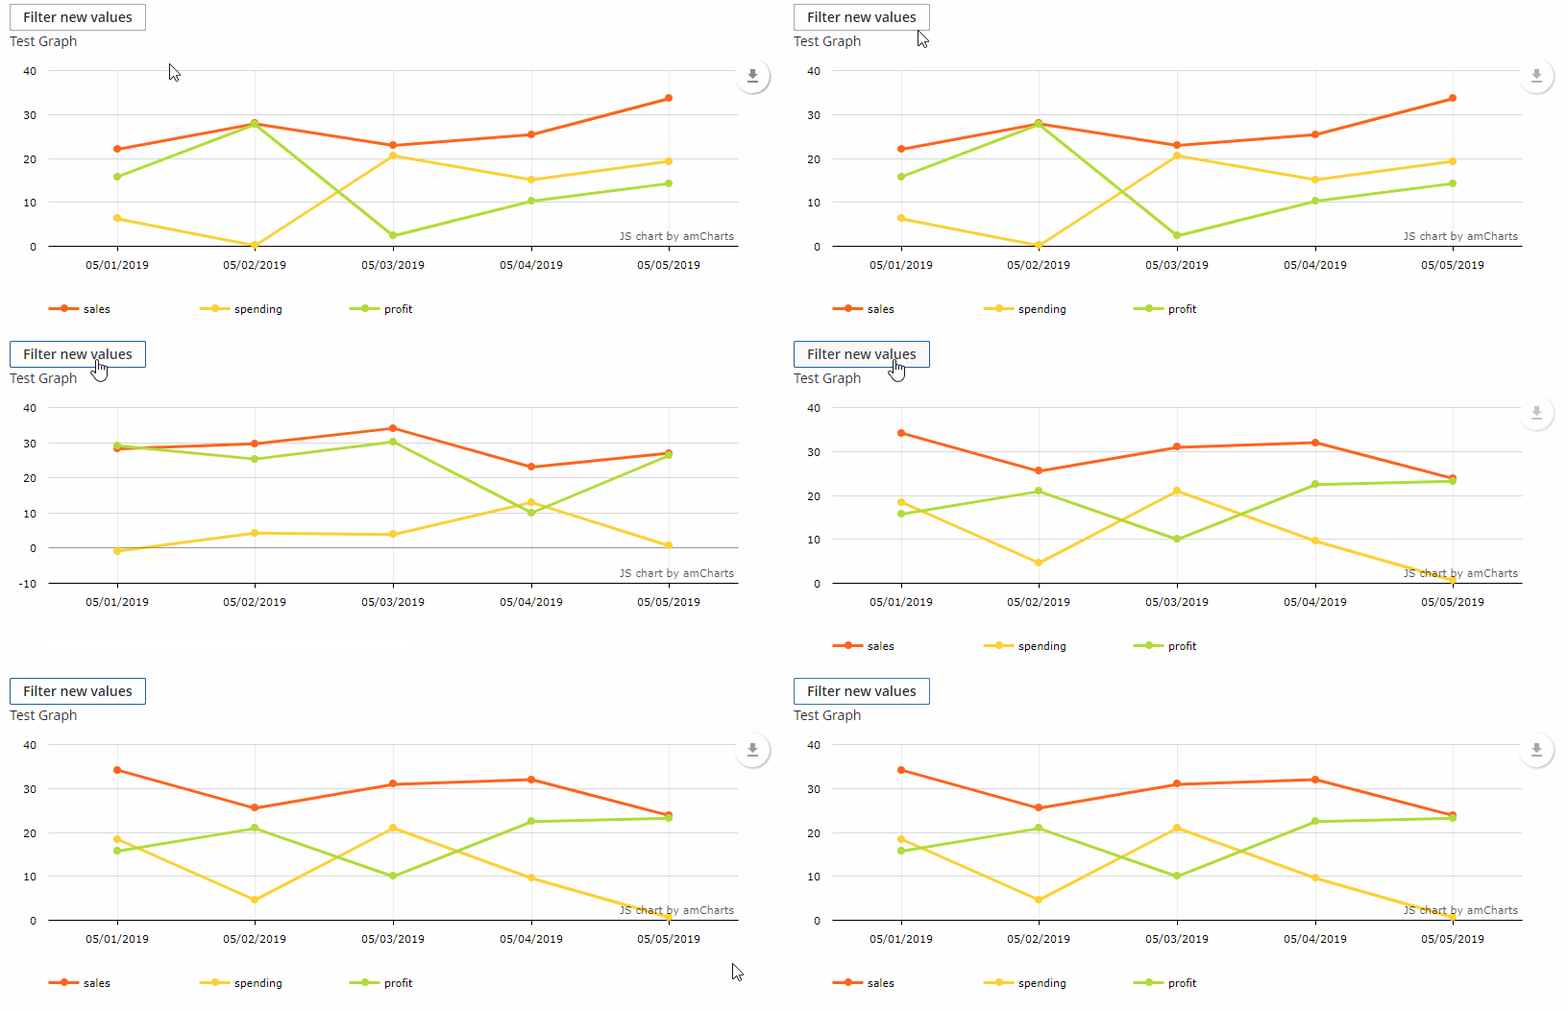
Could you clarify in more details, because with code above it works like this:
full method code
public void filterData() {
    List<Graph> graphs = testChart.getGraphs();
    if (CollectionUtils.isNotEmpty(graphs)) {
        graphs.clear();
    }

    ListDataProvider dataProvider = new ListDataProvider();
    testChart.setDataProvider(dataProvider);

    for (int i = 0; i < 5; i++) {
        String date = "05/0" + (i + 1) + "/2019";
        BigDecimal sales = generateRandomBigDecimalFromRange(
                new BigDecimal(20.90).setScale(2, BigDecimal.ROUND_HALF_UP),
                new BigDecimal(35.90).setScale(2, BigDecimal.ROUND_HALF_UP)
        );
        BigDecimal spending = generateRandomBigDecimalFromRange(
                new BigDecimal(-1.21).setScale(2, BigDecimal.ROUND_HALF_UP),
                new BigDecimal(21.28).setScale(2, BigDecimal.ROUND_HALF_UP)
        );
        BigDecimal profit = sales.subtract(spending);
        dataProvider.addItem(MapDataItem.of("date", date,
                "sales", sales,
                "spending", spending,
                "profit", profit));
    }

    String currProdCode = null;
    Graph sales = new Graph()
            .setId("sales")
            .setStackable(true)
            .setType(GraphType.LINE)
            .setBullet(BulletType.ROUND)
            .setBalloonText("sales [[sales]]")
            .setLineThickness(3)
            .setTitle("sales")
            .setValueField("sales");
    Graph spending = new Graph()
            .setId("spending")
            .setStackable(true)
            .setType(GraphType.LINE)
            .setBullet(BulletType.ROUND)
            .setBalloonText("spending [[spending]]")
            .setLineThickness(3)
            .setTitle("spending")
            .setValueField("spending");
    Graph profit = new Graph()
            .setId("profit")
            .setStackable(true)
            .setType(GraphType.LINE)
            .setBullet(BulletType.ROUND)
            .setBalloonText("profit [[profit]]")
            .setLineThickness(3)
            .setTitle("profit")
            .setValueField("profit");
    testChart.addGraphs(sales, spending, profit);
    testChart.repaint();
}
