stockGraphs problem comparison

Hi all,
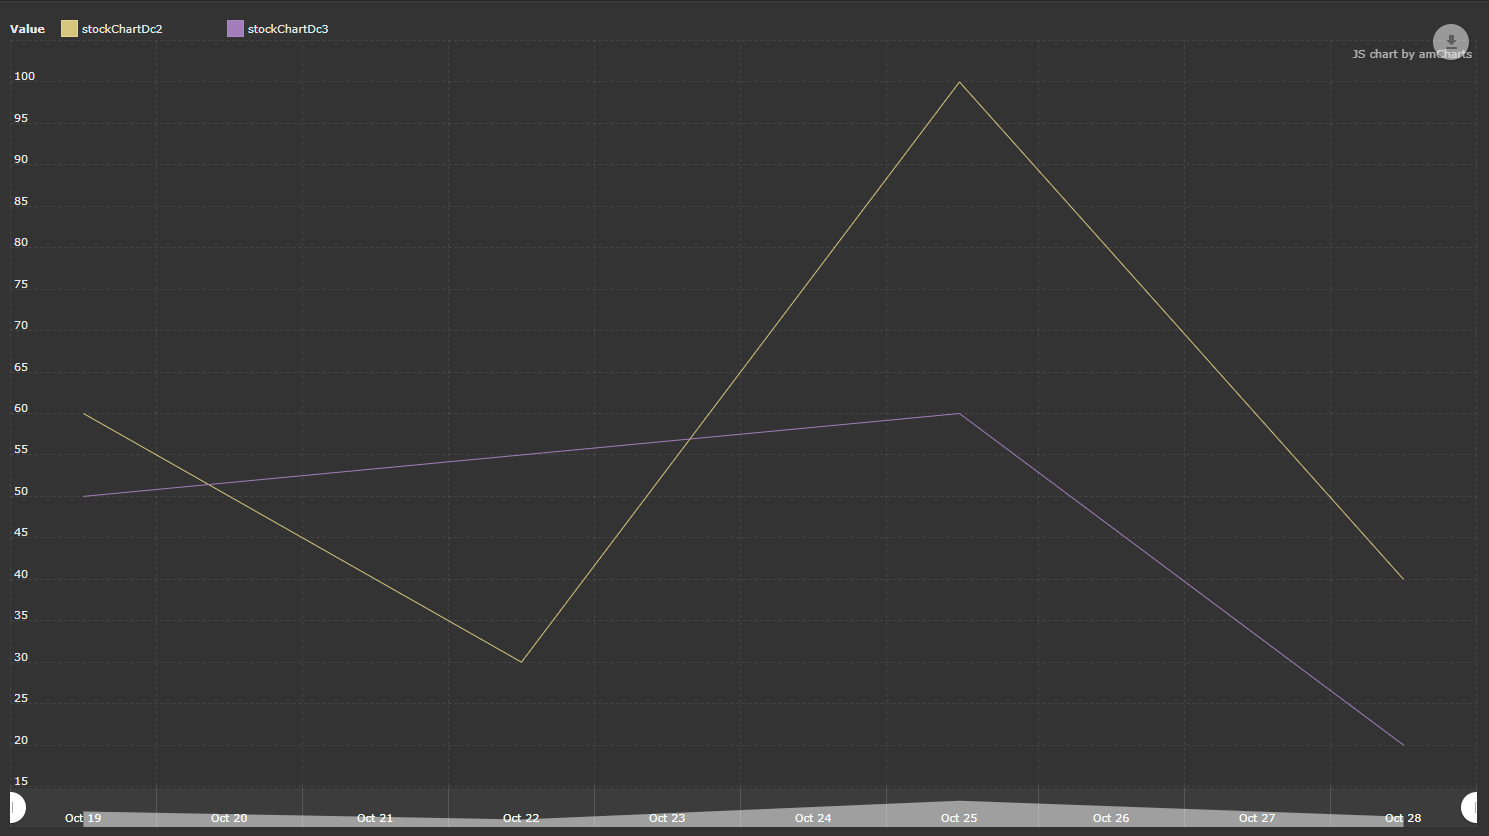
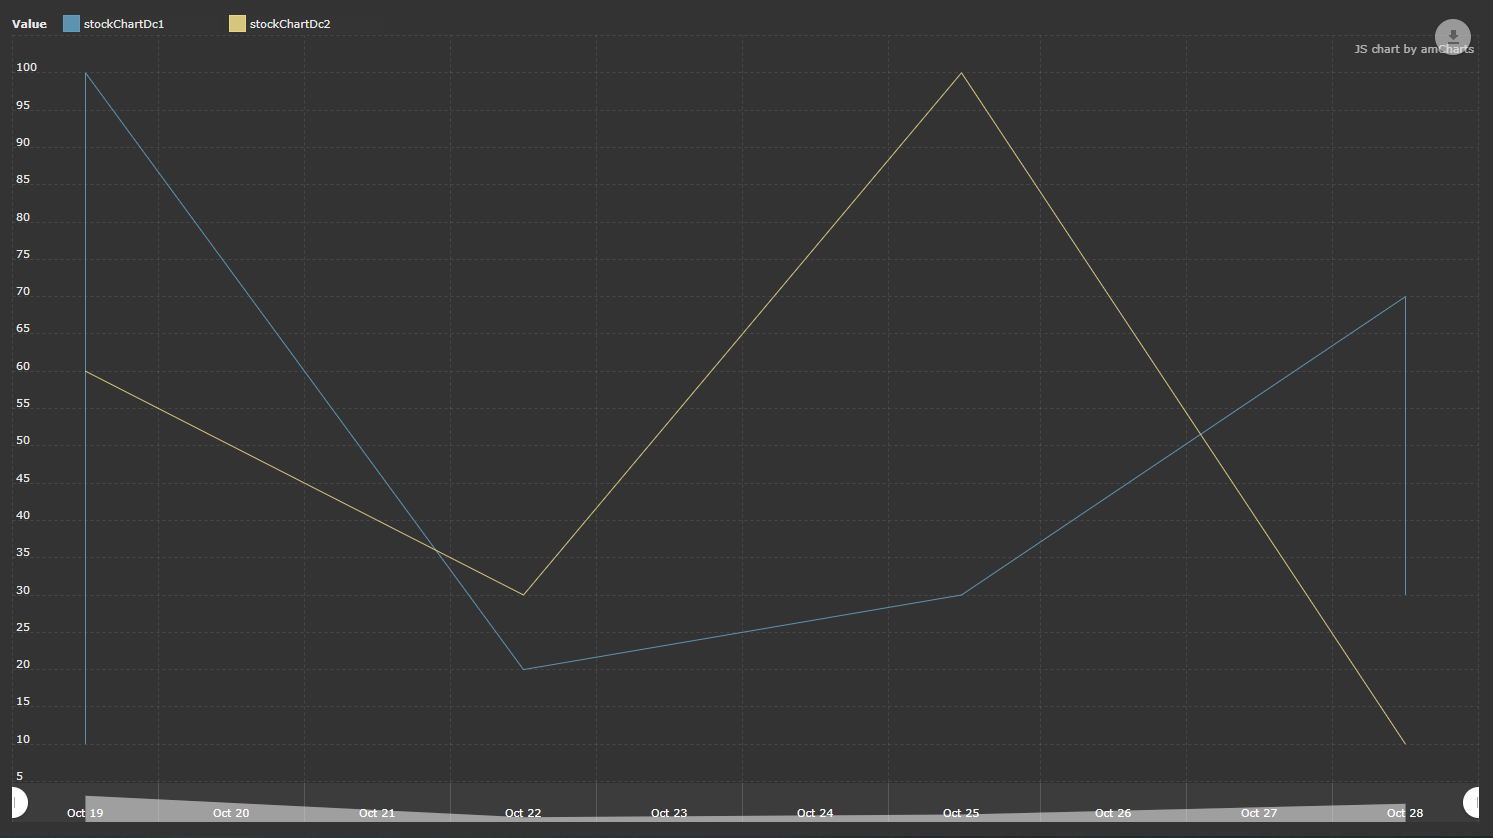
I have a problem with the stockGraphs, when I enabled the second series in the graph the y-axis change from the absolute value to percent value, I would compare the series on the absolute values. Where I can change this property?

This is the graph:

    <data>
       <collection id="stockChartDc1" class="DateValue" view="_local"/>
       <collection id="stockChartDc2" class="DateValue" view="_local"/>        
    </data>

    <chart:stockChart id="stockChart" height="100%" width="100%">
        <chart:dataSets>
            <chart:dataSet id="dataSet1" categoryField="date"
                           dataContainer="stockChartDc1" title="Serie 1">
                 <chart:fieldMappings>
                     <chart:fieldMapping fromField="value" toField="value"/>
                 </chart:fieldMappings>
            </chart:dataSet>

            <chart:dataSet id="dataSet2" categoryField="date"
                               dataContainer="stockChartDc2" title="Serie 2">
                 <chart:fieldMappings>
                     <chart:fieldMapping fromField="value" toField="value"/>
                 </chart:fieldMappings>
            </chart:dataSet>

            <chart:panels>
                 <chart:panel percentHeight="100" showCategoryAxis="false" title="Value">
                      <chart:stockGraphs>
                          <chart:stockGraph id="stockGraph"
                                              balloonText="[[title]]:&lt;strong&gt;[[value]]&lt;/strong&gt;"
                                              comparable="true"
                                              compareField="value"
                                              compareGraphBalloonText="[[title]]:&lt;strong&gt;[[value]]&lt;/strong&gt;"
                                              valueField="value"/>
                      </chart:stockGraphs>
                      <chart:stockLegend valueTextComparing="[[value]]"/>
                  </chart:panel>
                </chart:panels>
              <chart:chartScrollbarSettings graph="stockGraph"/>
</chart:stockChart>

This is the obj DateValue:

public class DateValue extends BaseUuidEntity {
    @MetaProperty(mandatory = true)
    protected Date date;

    @MetaProperty(mandatory = true)
    protected Long value;
}

A secondary question is how can load both series on default? I see that there’s “mainDataSet” property for the chart, but can I set two o more series for that property?

Thanks in advance

Hello Francesco,

  1. To compare absolute values set recalculateToPercents="false" in the <chart:panel> element. (doc link)

  2. If I understand you correctly, you want two compare two series when screen is loaded by default. You can set compared="true" (doc link):

    <chart:dataSet id="dataSet2"
                   compared="true"
    

Thanksss @Pinyazhin It’s works

Hi @Pinyazhin, I have another question on the stock graph, If the two dataset contains one obj for each day the graph is displayed correctly:

graph2

Instead if I insert in the dataset for example two obj for one day the graph doesn’t change the x-axis range (I would have expected to see the hours of the day as well):
These are the date for the two obj for the day 2020-10-19:

stockChartDc1
2020-10-19 12:27:00
2020-10-19 17:27:00

stockChartDc2
2020-10-19 16:27:00
2020-10-19 19:27:00

graph

There’s a way to force the change x-axis range?
thanks as always

Hello Francesco,

You could try to use minPeriod for the category axis:

<chart:categoryAxesSettings minPeriod="mm"/>

It will show minutes if you select a small range of scrollbar.