Sorry how to draw the guide like the graph below for date type category not year type.
Hi,
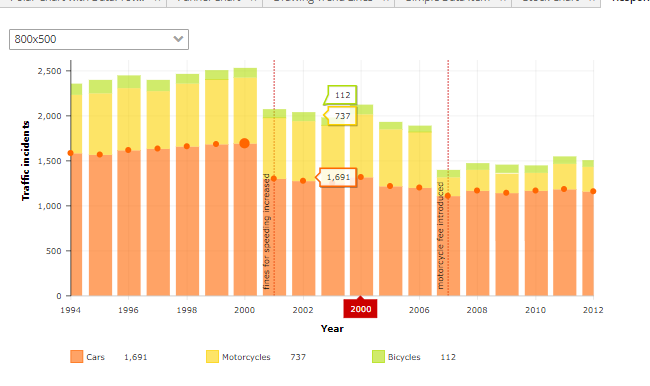
In order to add a guide to a date based chart, you need to define the date attribute, e.g.
<chart:guide date="2012-08-15"
             dashLength="2"
             inside="true"
             label="motorcycle fee introduced"
             labelRotation="90"
             lineAlpha="1"
             lineColor="#CC0000"/>
Regards,
Gleb
1 Like
Thanks solved.
Can i add button drawing and erase like this in serial chart?
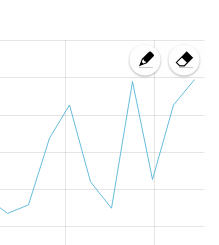
this is screenshoot from stock chart