I am trying to create an Excel report that contains a table and a chart. Should this be possible?
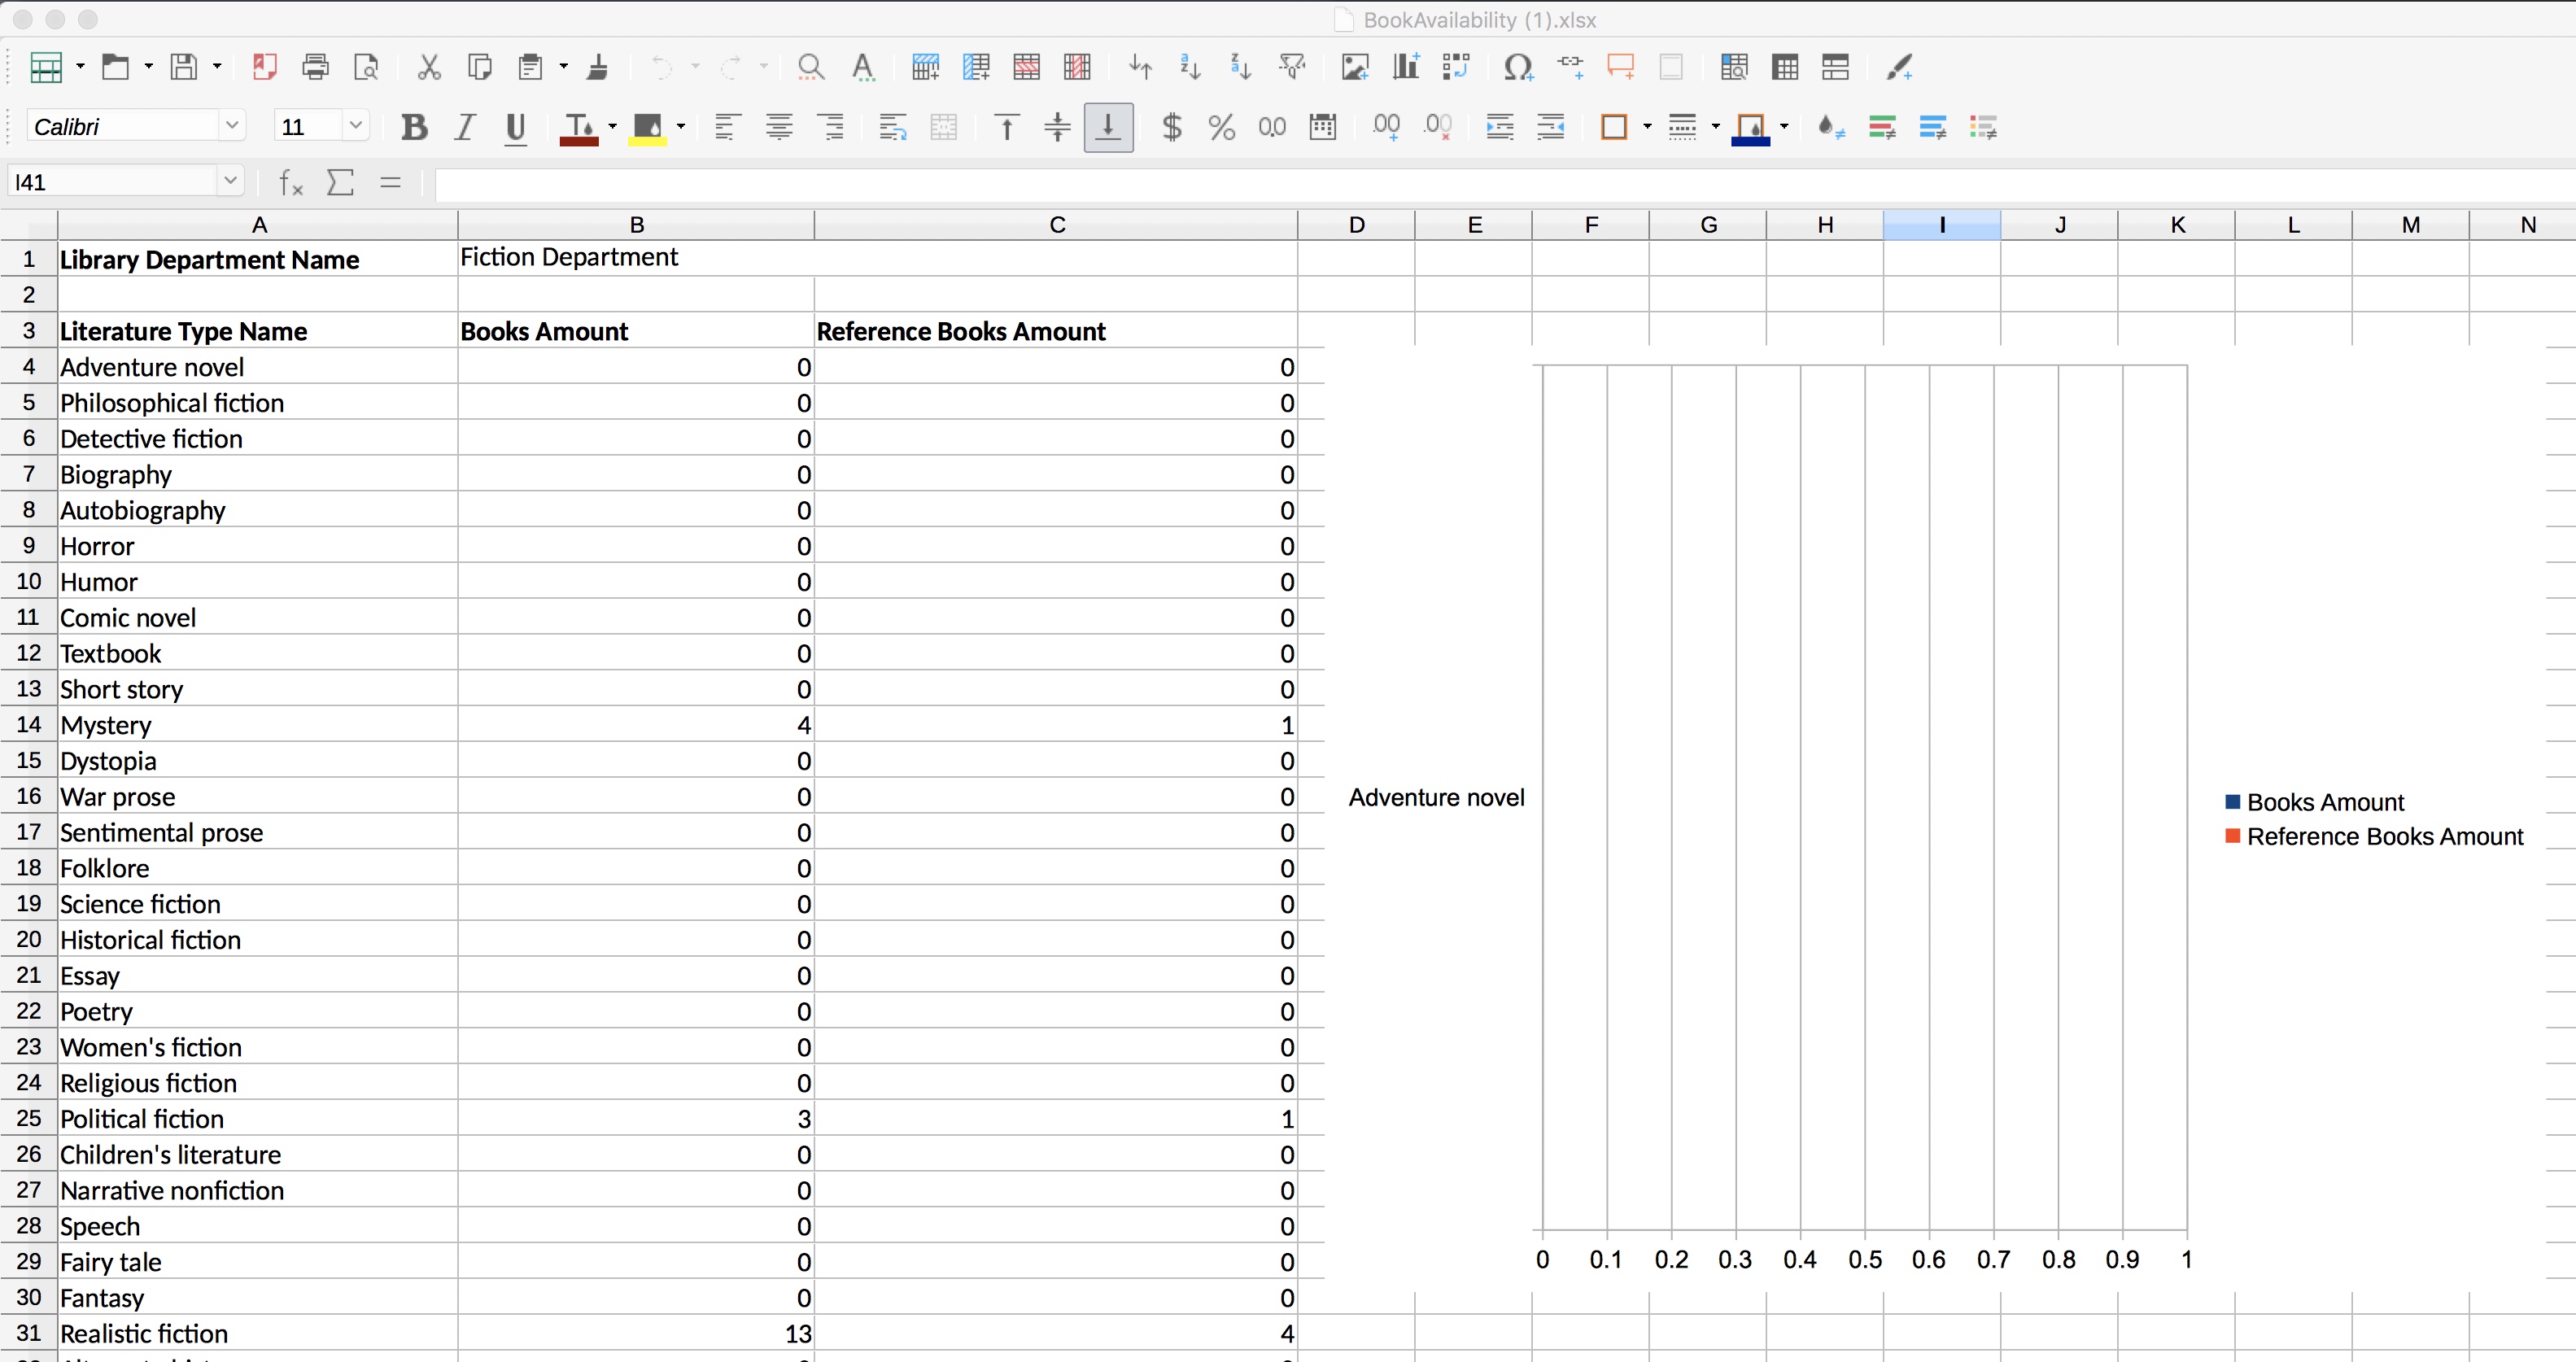
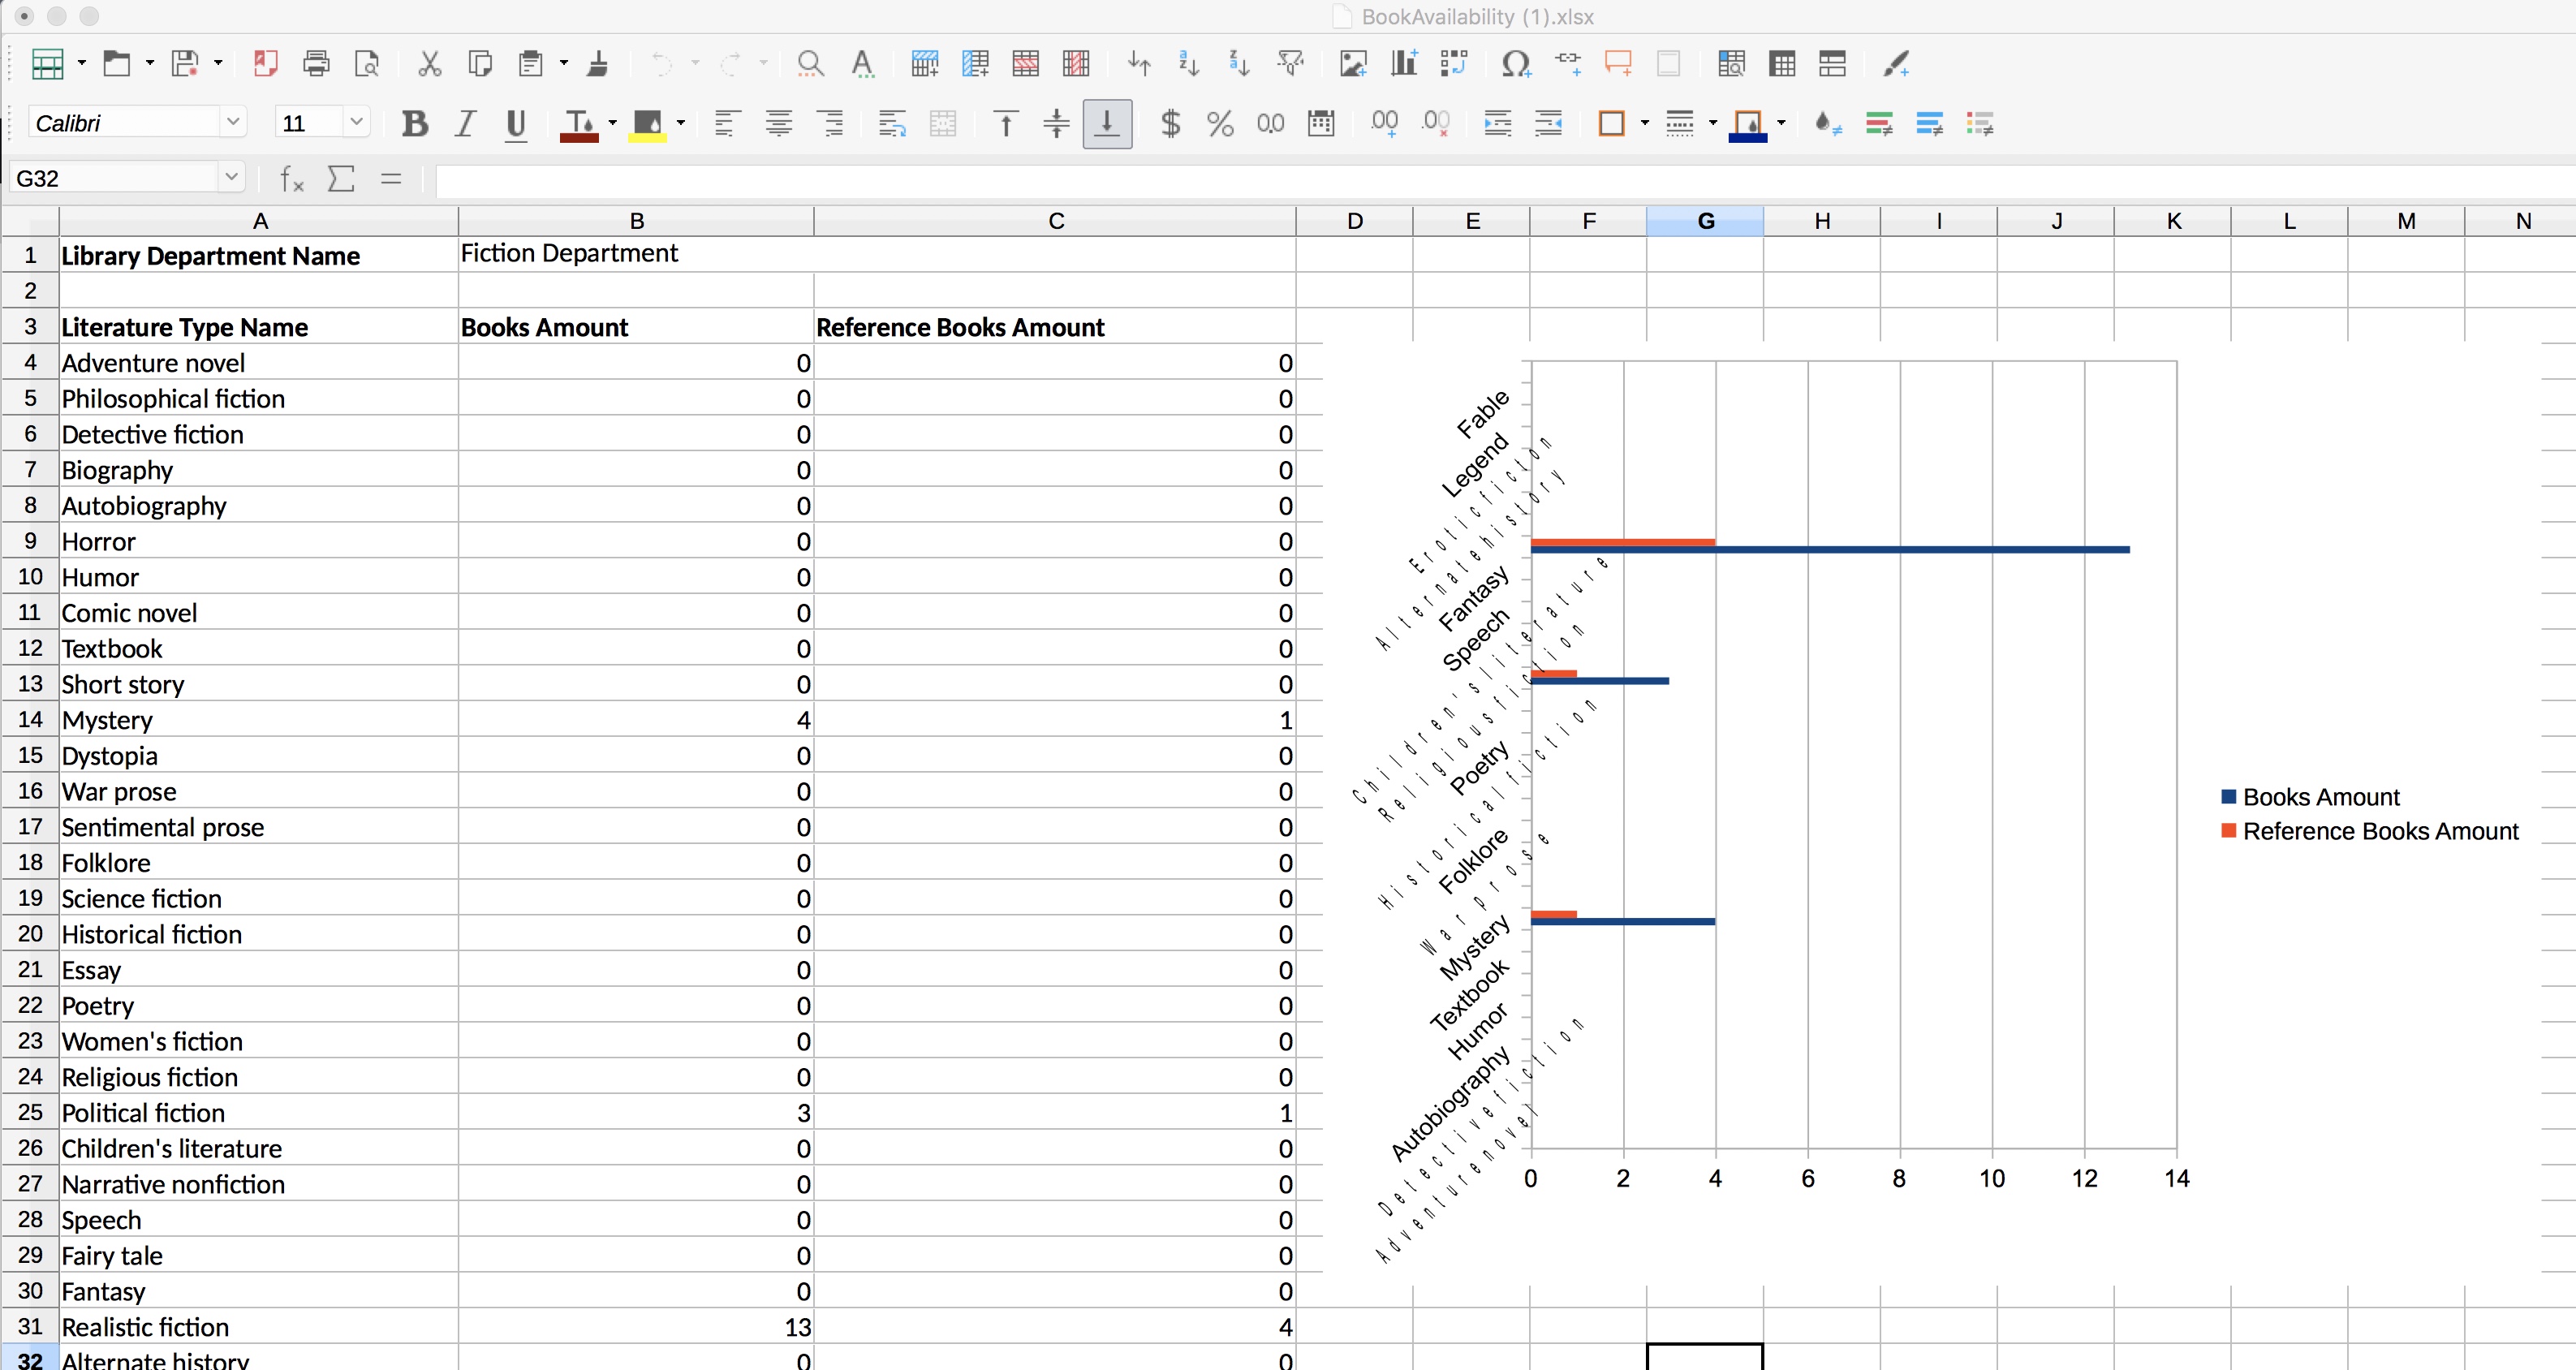
I took the Library sample project and enhanced the Book Availability report to include a chart. The report generates successfully but the data ranges in the chart are not updated like the table data is.
Does anyone have a sample project with a report having a chart I can look at?
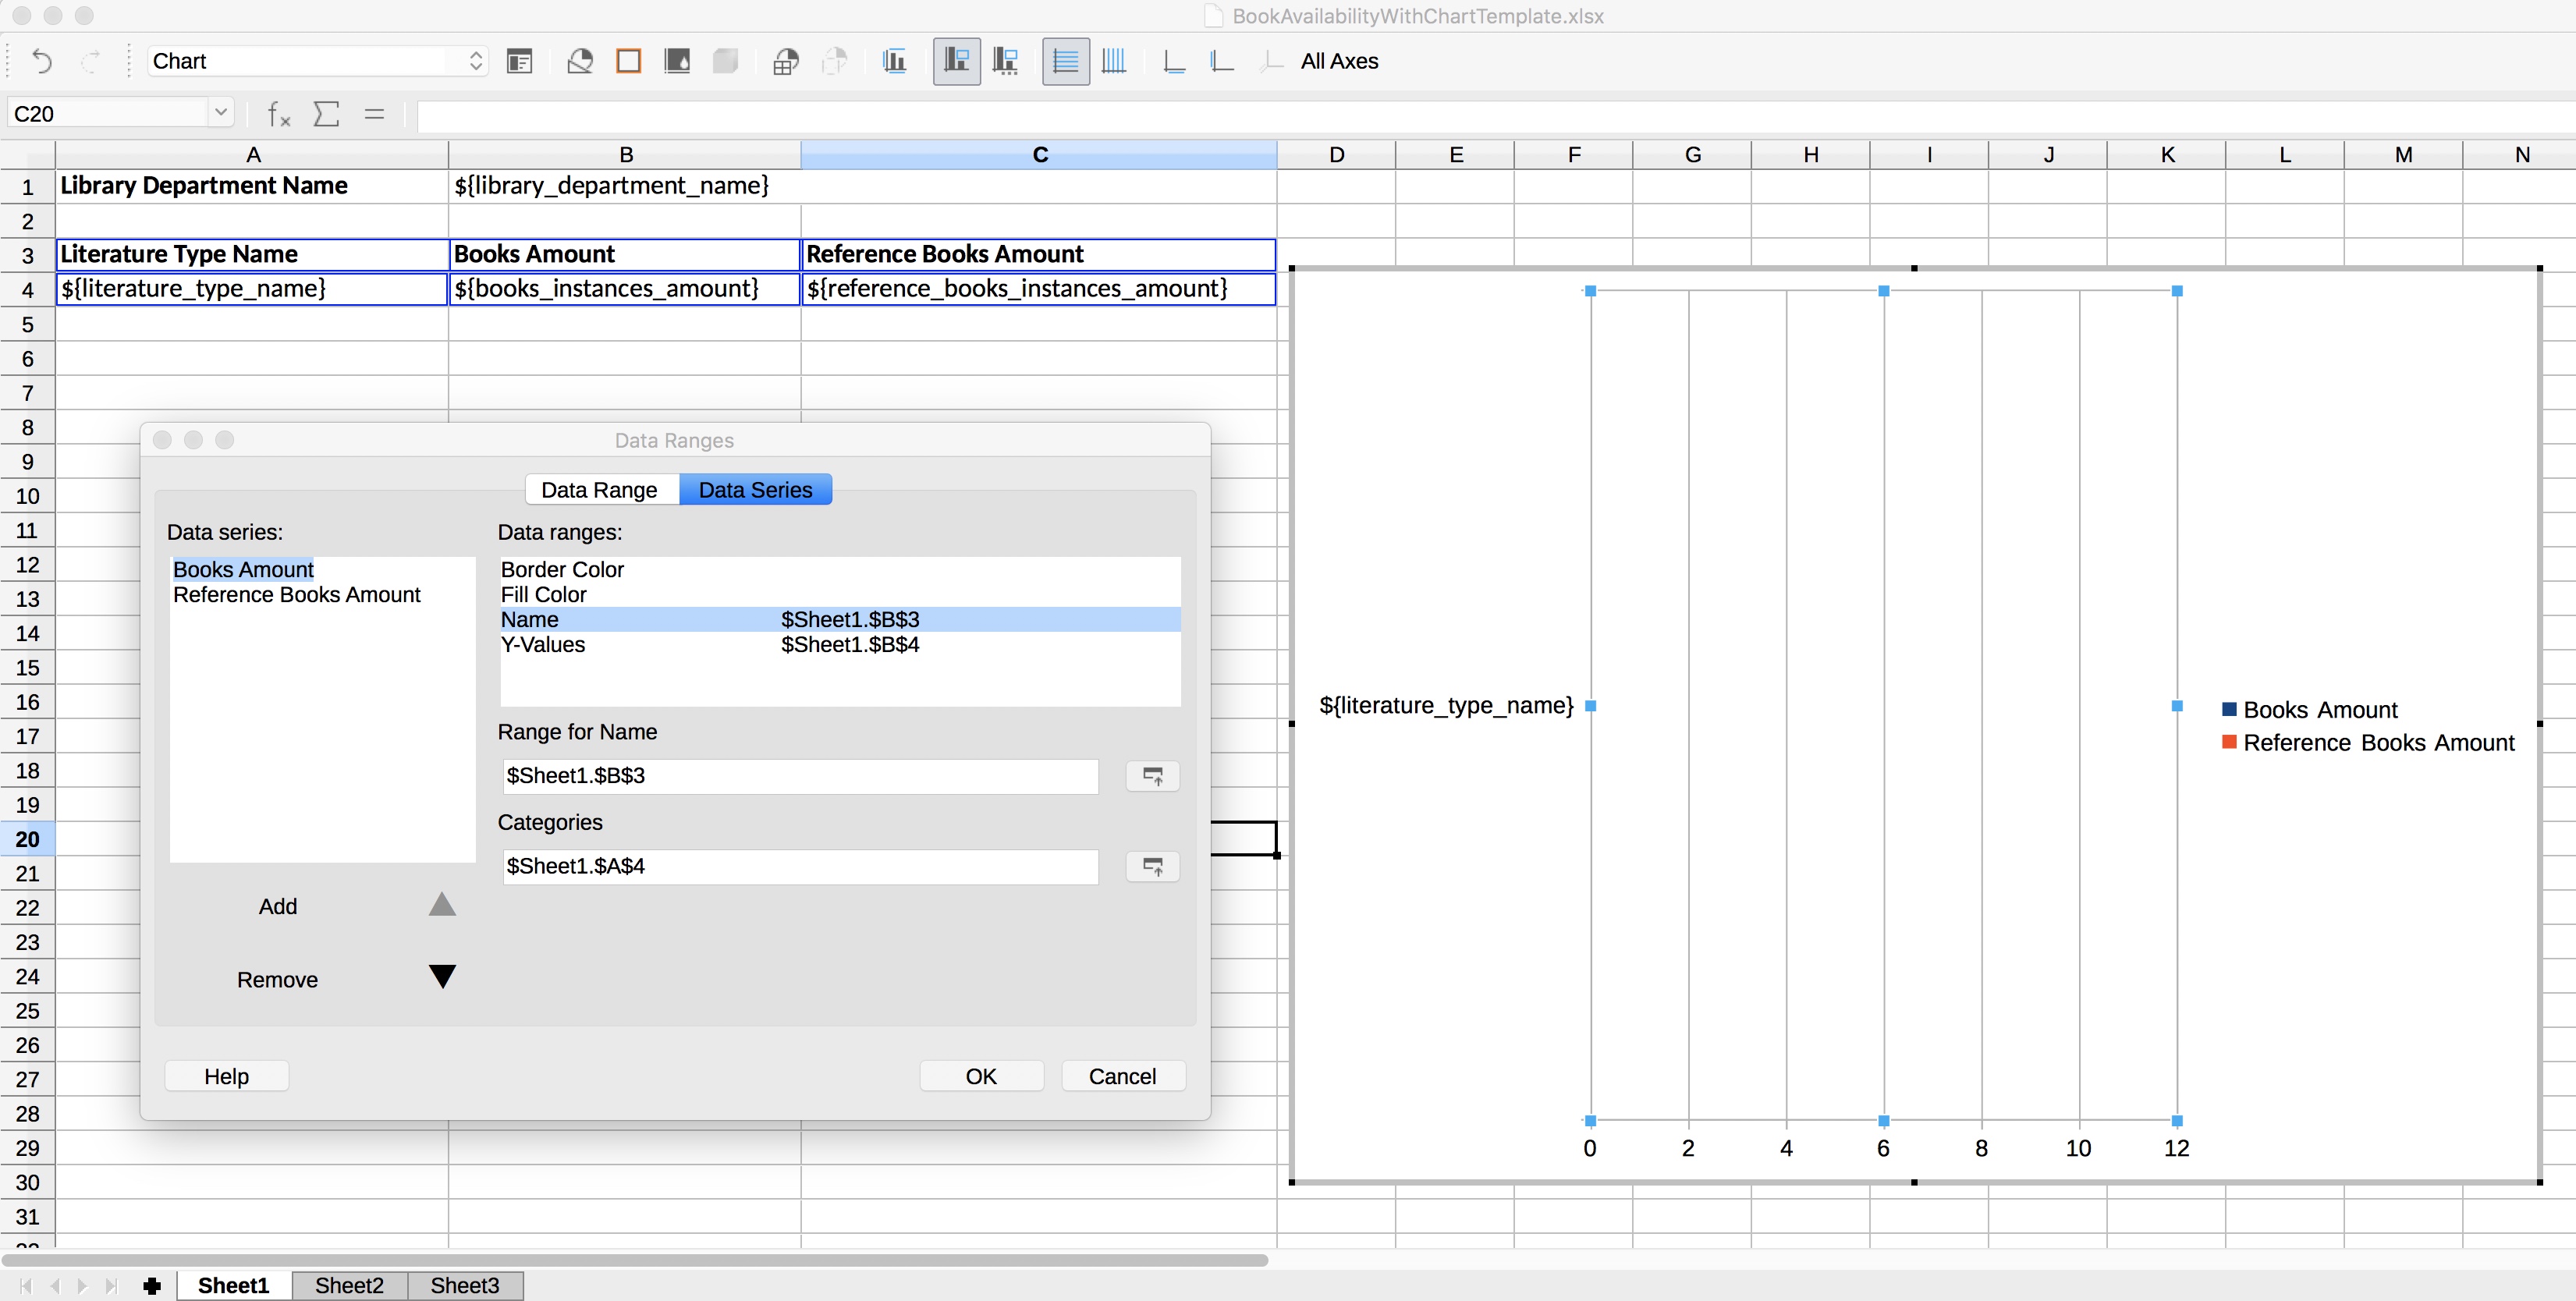
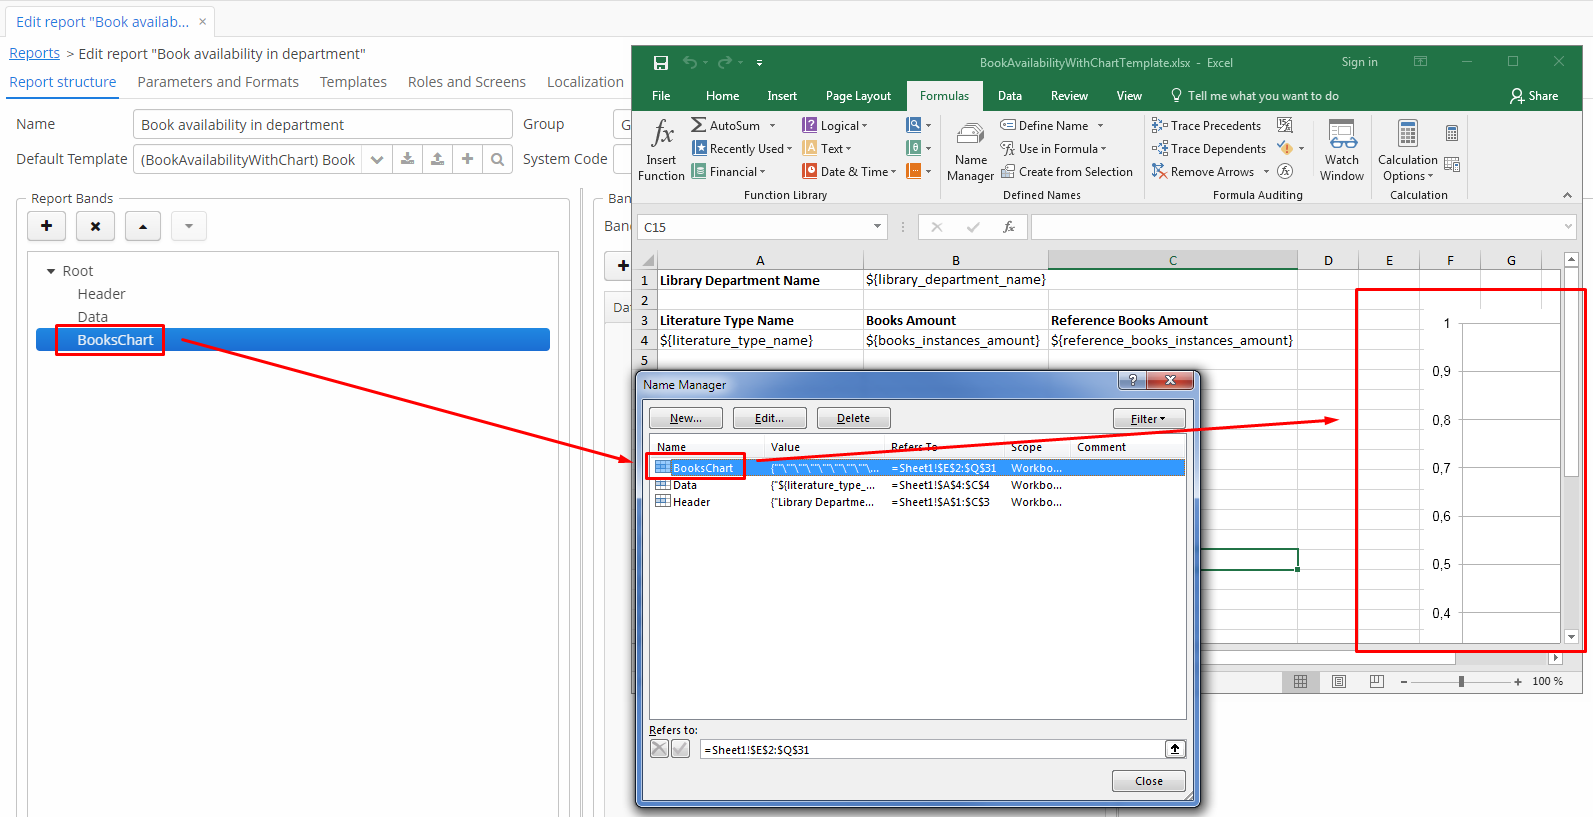
We’ve taken a look at your template. The problem was the following: to include a chart in a report, you need to 1) create an empty band in the report structure for this chart, 2) create a named region in the template file with the same name as this empty band, 3) create the chart within this named region.