PivotTable JS function not recognized

Hi

I’m trying to use the pivot table component but it seems I’m struggling to define a correct xml.

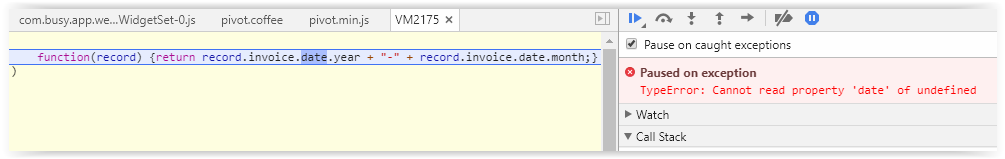
I’m trying to have in columns something called “period” <=> year concatenated with month, and defined a JS function to do so, but I keep having and error in Chrome. Using developer tools it seems the function is not recognized.

XML below, any help appreciated, I’m no beast in javascript.

<?xml version="1.0" encoding="UTF-8" standalone="no"?>
<window xmlns="http://schemas.haulmont.com/cuba/window.xsd"
        caption="msg://caption"
        class="com.busy.app.web.clientsinterests.ClientsInterests"
        messagesPack="com.busy.app.web.clientsinterests"
        xmlns:chart="http://schemas.haulmont.com/charts/charts.xsd">
    <dsContext>
        <groupDatasource id="clientsInterestsDs"
                         class="com.busy.app.entity.com.CustomerInvoiceSimpleLine"
                         view="customerInvoiceSimpleLine-price-view">
            <query>
                <![CDATA[select e from busy$CustomerInvoiceSimpleLine e where e.type = 'PRODUCT_SELL']]>
                <filter>
                    <and>
                        <c>e.customer.id = :param$customer</c>
                        <c>e.product.family.id = :param$family</c>
                        <c>e.product.id = :param$product</c>
                    </and>
                </filter>
            </query>
        </groupDatasource>
    </dsContext>
    <dialogMode height="600"
                width="800"/>
    <layout spacing="true">
        <scrollBox height="100%">
            <chart:pivotTable id="pivotClientsInterests"
                              datasource="clientsInterestsDs"
                              editable="true"
                              renderer="TABLE">
                <chart:aggregation mode="SUM_OVER_SUM">
                    <chart:property name="qty"/>
                    <chart:property name="grossAmount"/>
                </chart:aggregation>
                <chart:columns>
                    <chart:column value="periode"/>
                </chart:columns>
                <chart:derivedProperties>
                    <chart:derivedProperty caption="periode">
                        <**chart:function>**
**                            <![CDATA[function(record) {return record.invoice.date.year + "-" + record.invoice.date.month}]]>**
**                        </chart:function>**
                    </chart:derivedProperty>
                </chart:derivedProperties>
                <chart:properties>
                    <chart:property localizedName="client"
                                    name="invoice.customer"/>
                    <chart:property localizedName="famille"
                                    name="product.family"/>
                    <chart:property localizedName="article"
                                    name="product"/>
                    <chart:property localizedName="qté"
                                    name="qty"/>
                    <chart:property localizedName="px unit"
                                    name="unitPrice"/>
                    <chart:property localizedName="px rem"
                                    name="discountedPrice"/>
                    <chart:property localizedName="montant"
                                    name="grossAmount"/>
                </chart:properties>
                <chart:rows>
                    <chart:row value="invoice.customer"/>
                    <chart:row value="product.family"/>
                    <chart:row value="product"/>
                </chart:rows>
            </chart:pivotTable>
        </scrollBox>
    </layout>
</window>

Hi, @michael.renaud

Is the XML above the one you use in the app? If so, did you try to remove ** symbols?

Regards,
Gleb

Of course, ** symbols are there because I tried to set in bold the relevant part in the OP.

Beyond that what is incorrect in the function definition ?

Try to set ; after date.month, right before closing curly brace.

function(record) {return record.invoice.date.year + "-" + record.invoice.date.month;}

No chance

image

But I’m not surprised. I’m clearly not a JS ninja but I think “‘date’ of undefined” in error message means the invoice property is not traversable.

Hi,

if you take a look at your properties element, you will see that there is no invoice property is defined.

<chart:properties>
	<chart:property localizedName="client"
					name="invoice.customer"/>
	<chart:property localizedName="famille"
					name="product.family"/>
	<chart:property localizedName="article"
					name="product"/>
	<chart:property localizedName="qté"
					name="qty"/>
	<chart:property localizedName="px unit"
					name="unitPrice"/>
	<chart:property localizedName="px rem"
					name="discountedPrice"/>
	<chart:property localizedName="montant"
					name="grossAmount"/>
</chart:properties>

The properties element defines which entity attributes are serialized and passed to the client side of the component. Since you replaced default property names with custom using the localizedName attribute, you have to use this names in the JS function of derived attribute and for the rows and columns elements.

Ok Thanks Gleb that’s more clear now the function works. Now I run into the other issue I have reported

Hi,

I’ve answered there.