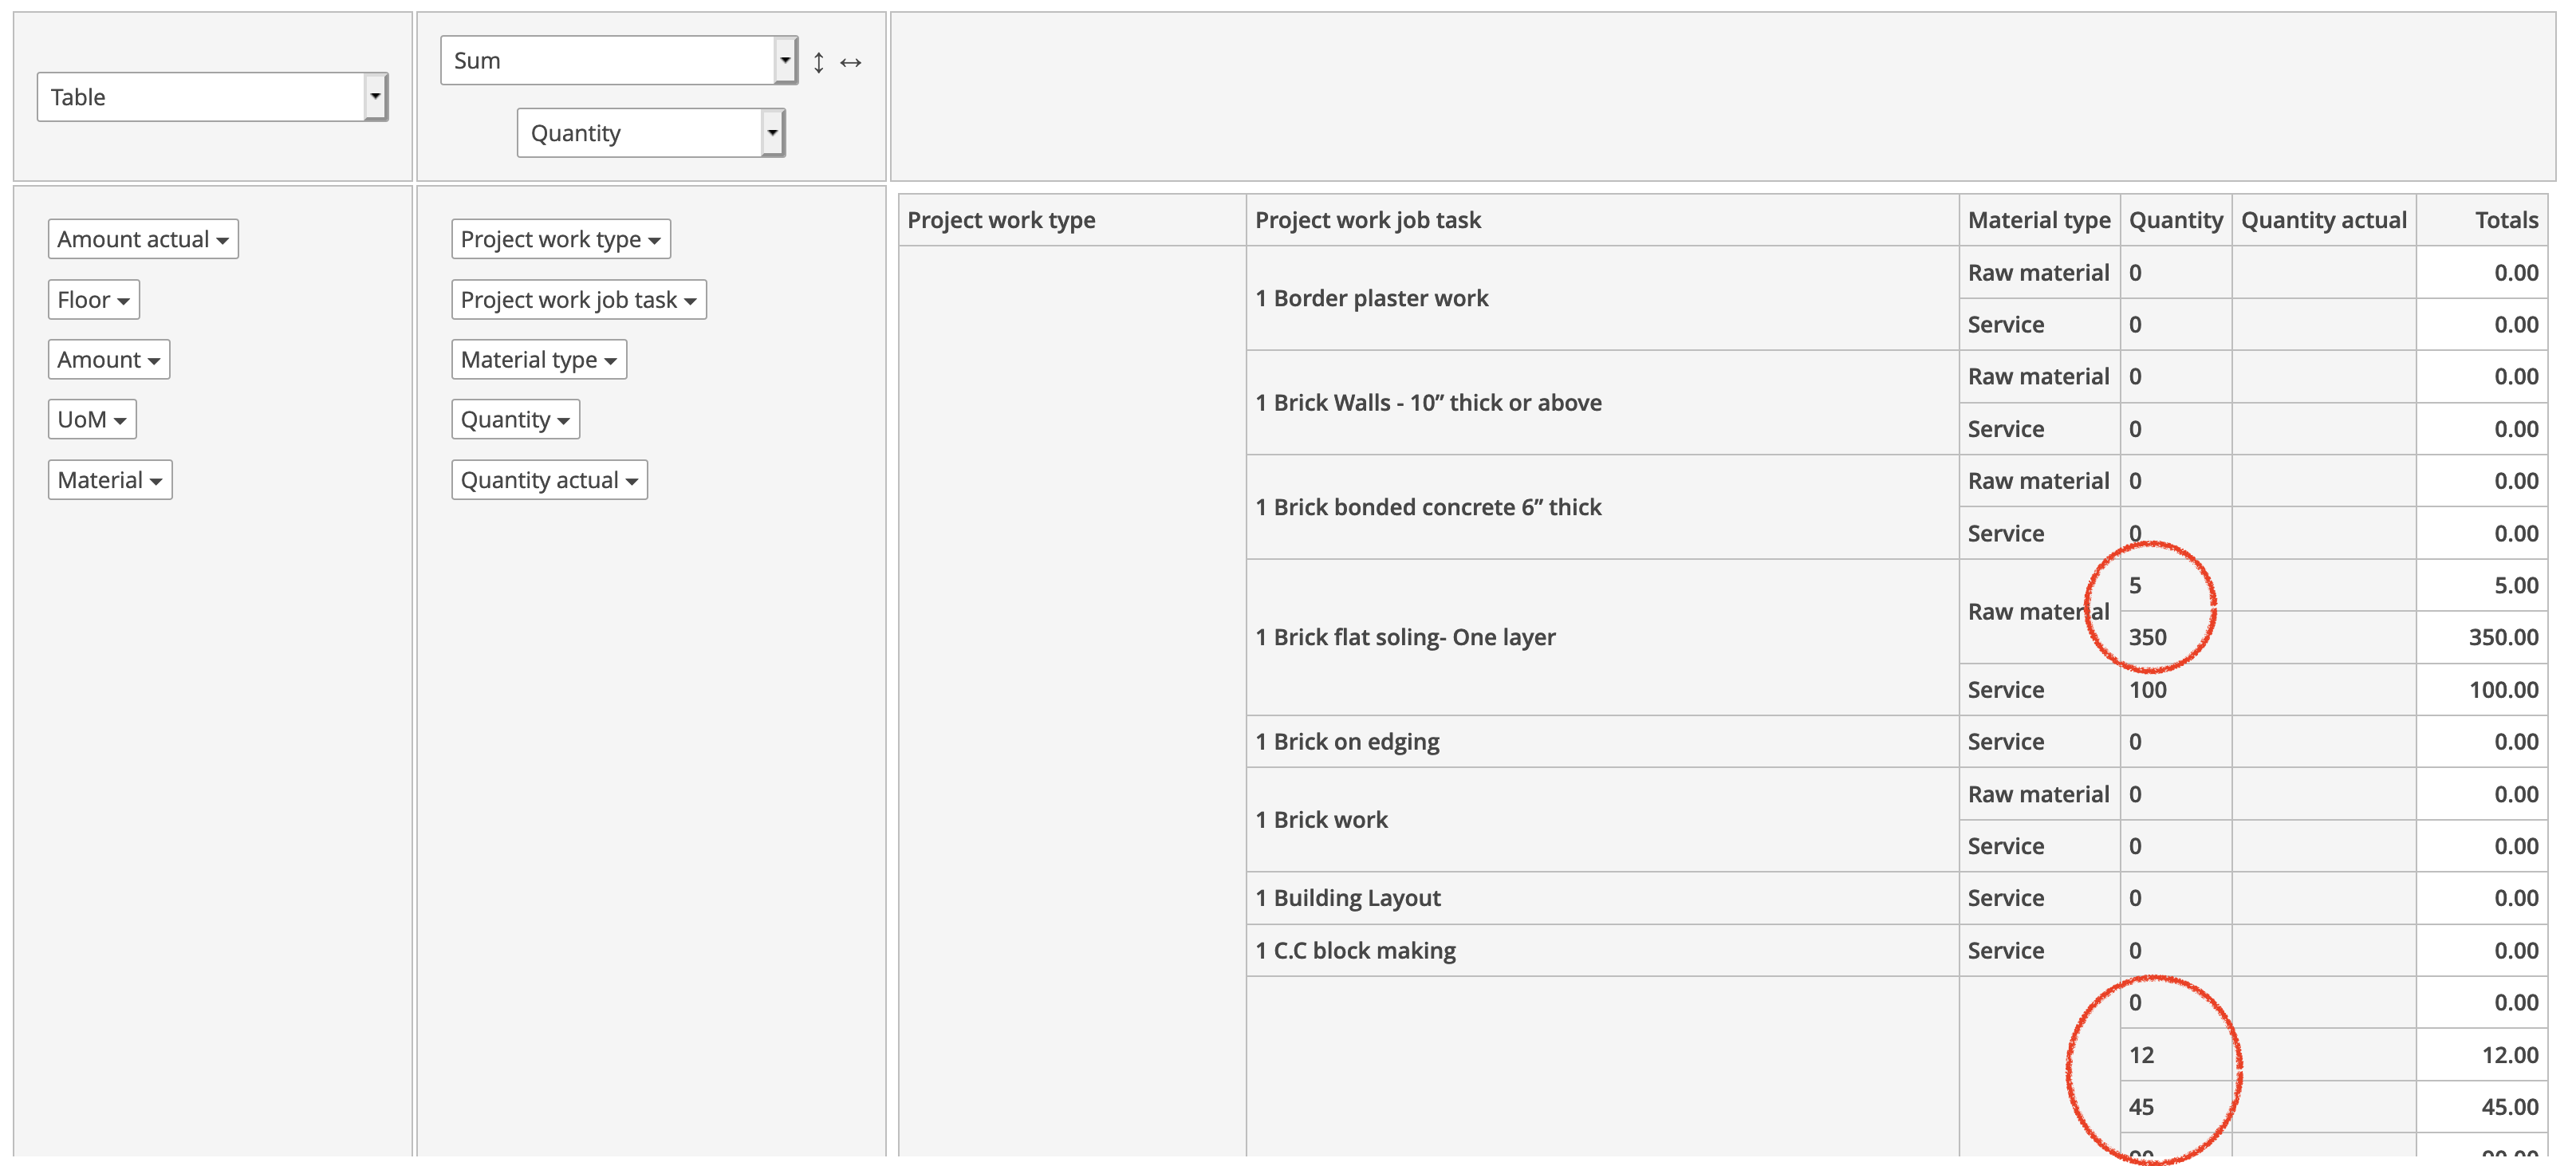
I have a PivotTable in my application where I have two columns (quantity, quantityActual). As you can see in the image below that the quantity or quantityActual columns are not aggregated as circled in red. How can I show them aggregated?
Here is my xml codes:
 <tab id="tabPivot"
             caption="PIVOT DISPLAY"
             margin="true,false,false,false"
             spacing="true">
            <chart:pivotTable id="pivotTable"
                              datasource="realEstateProjectCostLineDs"
                              editable="true"
                              height="100%"
                              renderer="TABLE"
                              responsive="true"
                              width="100%">
                <chart:aggregation mode="SUM">
                    <chart:property name="quantity"/>
                    <chart:property name="quantityActual"/>
                </chart:aggregation>
                <chart:aggregationProperties>
                    <chart:property name="quantity"/>
                    <chart:property name="quantityActual"/>
                </chart:aggregationProperties>
                <chart:aggregations default="SUM"/>
                <chart:columns/>
                <chart:properties>
                    <chart:property name="realEstateProjectWorkType"/>
                    <chart:property name="realEstateProjectWorkJobTask"/>
                    <chart:property name="materialType"/>
                    <chart:property name="realEstateProjectFloor"/>
                    <chart:property name="unitOfMeasure"/>
                    <chart:property name="material"/>
                    <chart:property name="quantity"/>
                    <chart:property name="quantityActual"/>
                    <chart:property name="amount"/>
                    <chart:property name="amountActual"/>
                </chart:properties>
                <chart:rows>
                    <chart:row value="realEstateProjectWorkType"/>
                    <chart:row value="realEstateProjectWorkJobTask"/>
                    <chart:row value="materialType"/>
                    <chart:row value="quantity"/>
                    <chart:row value="quantityActual"/>
                </chart:rows>
            </chart:pivotTable>
        </tab>
My second question is, I need a 3rd column that is calculated from subtracting “quantityActual” from “quantity” columns. Is it something I should use “derived properties”, if so, how?