Want to add a derived Property from a base property SDate which includes dates from the previous month from SDate values . How can I write the JS Function for the same?Hello!
Could you clarify in more details your problem? Code examples are appreciated.
Hello,
I’ll elaborate the question here for u. Thanks for reply though!
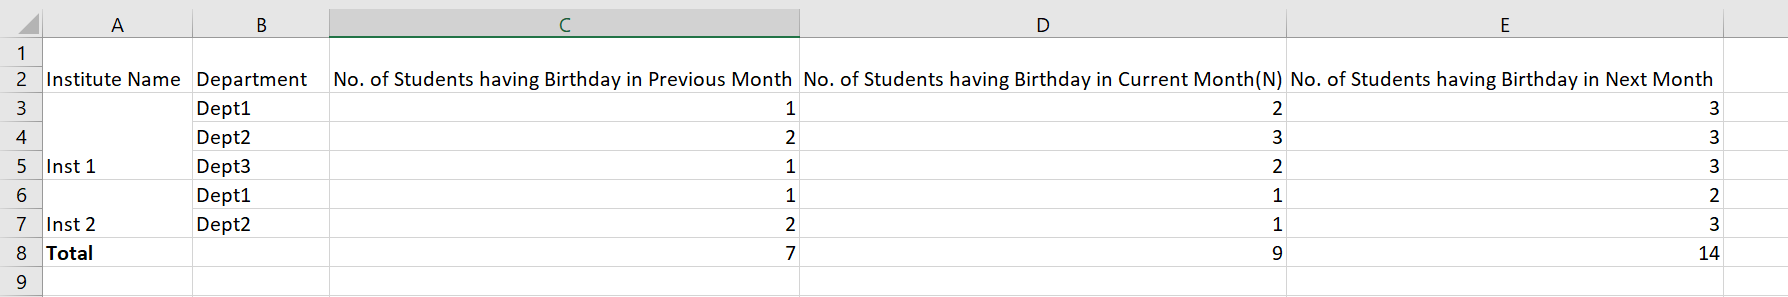
Suppose I’ve four attributes viz. Institute Name, Department Name, Student Id(unique) and Student birthdate. Now I want to display the data in the format as shown in the screenshot below. Is it possible using Pivot table? If yes, how?
So you need to show “previous”, “current” and “next” from your birthdate property instead of real date?
If you have an entity you can create a transient field and fill it when entity is loaded.
For instance, I’ve create a transient filed with Enum type (to simplify localization if needed):
@Transient
@MetaProperty
private String birthDateMonth;

public BirthDateMonth getBirthDateMonth() {
    return BirthDateMonth.fromId(birthDateMonth);
}
public void setBirthDateMonth(BirthDateMonth birthDateMonth) {
    this.birthDateMonth = birthDateMonth.getId();
}

@PostLoad
public void postLoad() {
    // get birthdate and check month with current
}
Birthdate enum
public enum BirthDateMonth implements EnumClass<String> {

    CURRENT("current"),
    PREVIOUS("previous"),
    NEXT("next");

    private String id;

    BirthDateMonth(String value) {
        this.id = value;
    }

    public String getId() {
        return id;
    }

    @Nullable
    public static BirthDateMonth fromId(String id) {
        for (BirthDateMonth at : BirthDateMonth.values()) {
            if (at.getId().equals(id)) {
                return at;
            }
        }
        return null;
    }
}
Then add property to the PivotTable properties and columns:
<chart:pivotTable id="pivotTable"
                  dataContainer="my_data_container">
    <chart:properties>
        ...
        <chart:property name="birthDateMonth"/>
    </chart:properties>

    <chart:columns>
        <chart:column value="birthDateMonth"/>
        ...
    </chart:columns>

    ...
</chart:pivotTable>
The examples of PivotTable you can find in the Sampler.
Also, see documentation: 4. Displaying PivotTable
Hello!
Actually I don’t just need to show “previous”, “current”, “next” from birthday property. I need count under each category for a given Institute name and Department. So I probably need to add three derived properties. I want to know if it’s possible to represent the data in the exact format shown in the screenshot shared above using pivot table or any other component.
Thanks,
Manali
Hello!
Sure, it is possible. The example above demonstrate how to avoid using derived attributes.
I’ve prepared a small demo project: demo.zip (91.2 KB)
For derived attributes you have to write JS function and use JS tools for processing data. Also, there can be a problem with localization if your application uses multiple languages . Example for derived attributes:
<charts:pivotTable id="pivotTable"
                   dataContainer="studentsDc">
    <charts:properties>
        <charts:property name="institute"/>
        <charts:property name="department"/>
        <charts:property name="birthDate"/>
    </charts:properties>
    <charts:columns>
        <charts:column value="msg://pivotScreen.birthDateMonth"/>
    </charts:columns>
    <charts:derivedProperties>
        <charts:derivedProperty caption="msg://pivotScreen.birthDateMonth">
            <charts:function>
                function(item) {
                    var birthDate = item.Birthdate; // date has string type

                    // check date and return localized value

                    // return "No. of Students having Birthday in Current Month";
                    // or
                    // return "No. of Students having Birthday in Previous Month"
                    // or
                    return "No. of Students having Birthday in Next Month";
                }
            </charts:function>
        </charts:derivedProperty>
    </charts:derivedProperties>
    <charts:rows>
        <charts:row value="institute"/>
        <charts:row value="department"/>
    </charts:rows>
</charts:pivotTable>
1 Like
Thank you!!! Works fine.