Hey,
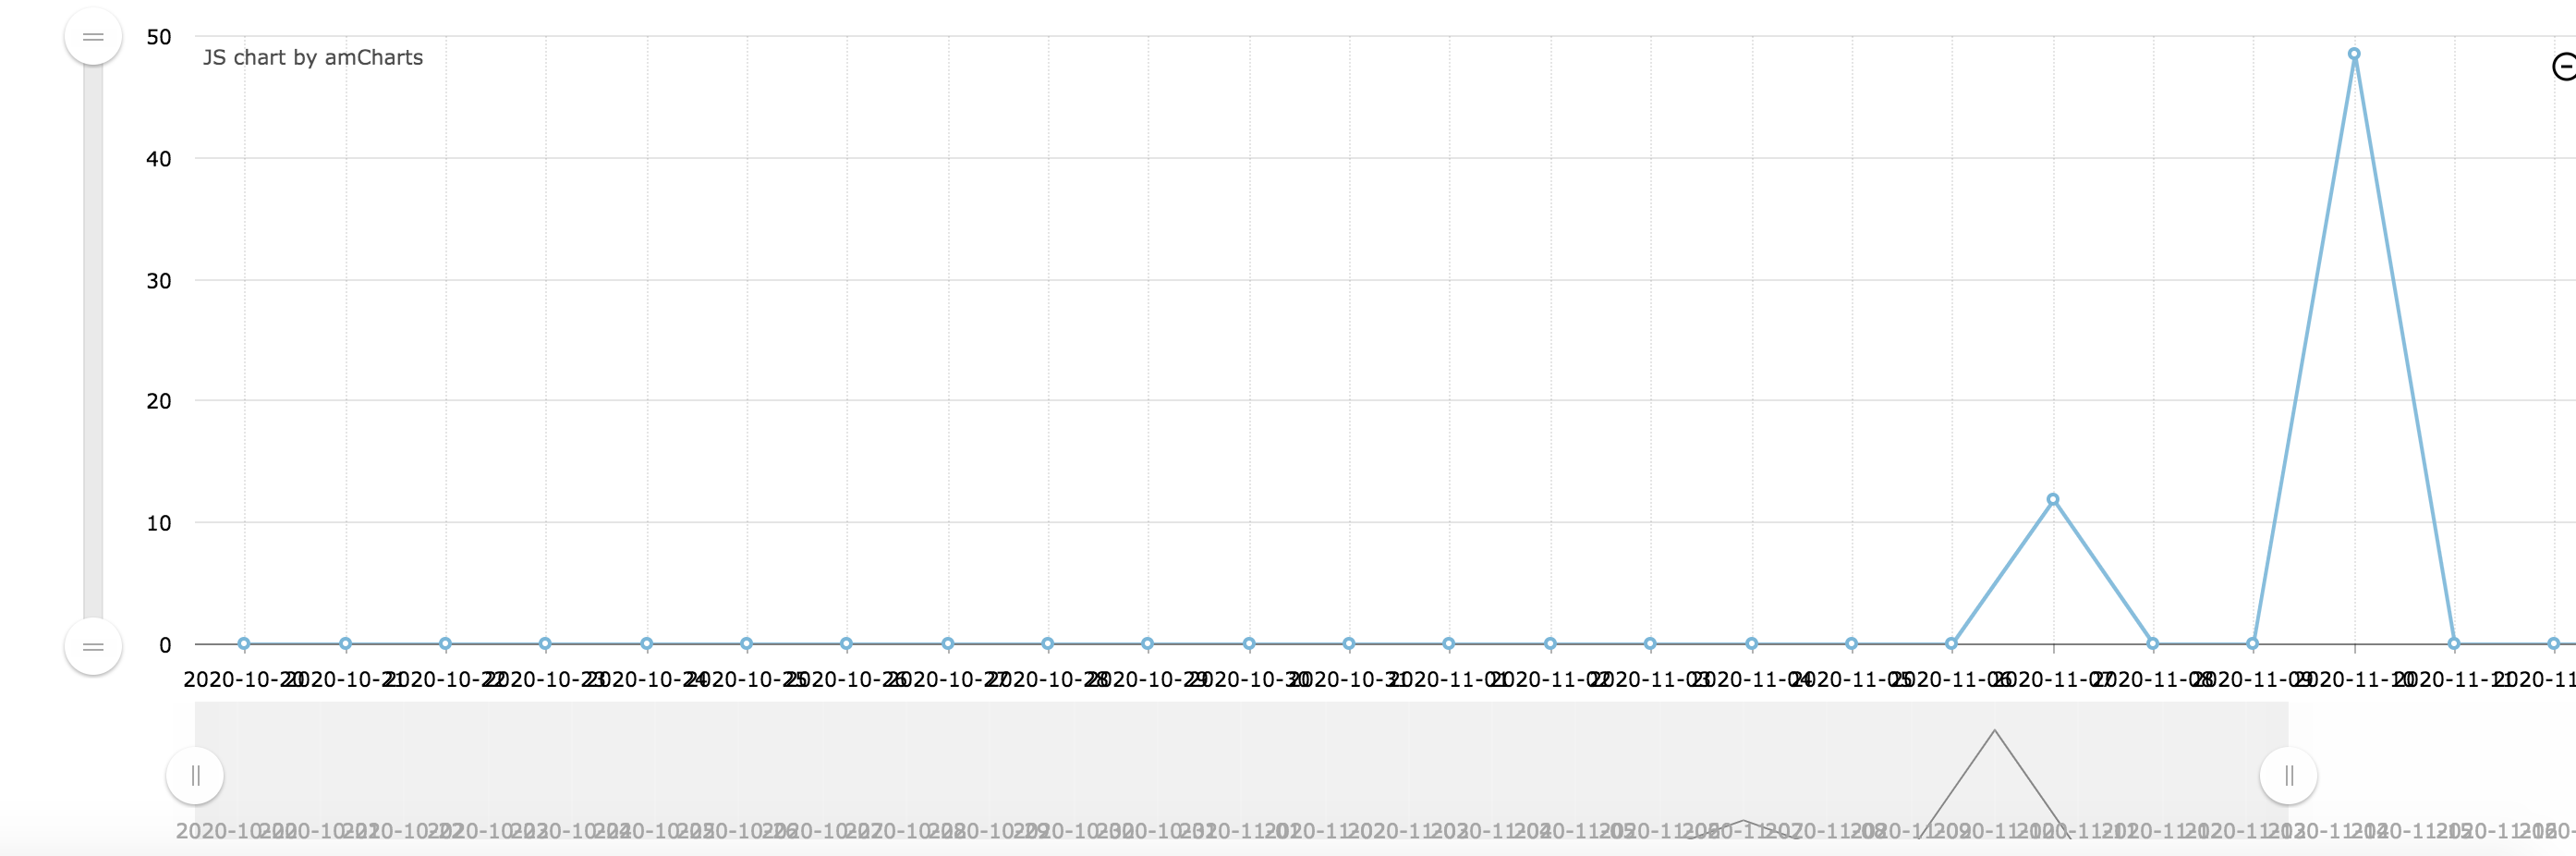
I have implemented this graph. on the Y-Axis the value is “date”. and it doesn’t fit into the webpage.
Is there any option to adjust these values or to hide the y-axis values? Please check the image below.
Hey,
I have implemented this graph. on the Y-Axis the value is “date”. and it doesn’t fit into the webpage.
Is there any option to adjust these values or to hide the y-axis values? Please check the image below.
Hello,
it seems the chart does not recognize values as dates. May be field value is not a date type. Try this attribute for the categoryAxis:
<chart:categoryAxis parseDates="true"/>
Also, take a look at the line-chart example in the Sampler app.
Okay! I understand the provided solution. Thanks 
Just one more question out of the curiosity, is there any setting to hide the values on the y-axis?
This attribute should help:
<chart:valueAxes>
    <chart:axis labelsEnabled="false"/>
</chart:valueAxes>
AmCharts documentation: labelsEnabled.
It worked! Thankyou so much !!