Hi there, I’ve installed charts and works fine. Now there is a new reqiurement which show more than one chart on one page. I tried several options in xml but nothing works.
Is there a way how to do?
Thanks.
Hi there, I’ve installed charts and works fine. Now there is a new reqiurement which show more than one chart on one page. I tried several options in xml but nothing works.
Is there a way how to do?
Thanks.
Hello!
Could you clarify what does not work and share the XML you tried to use?
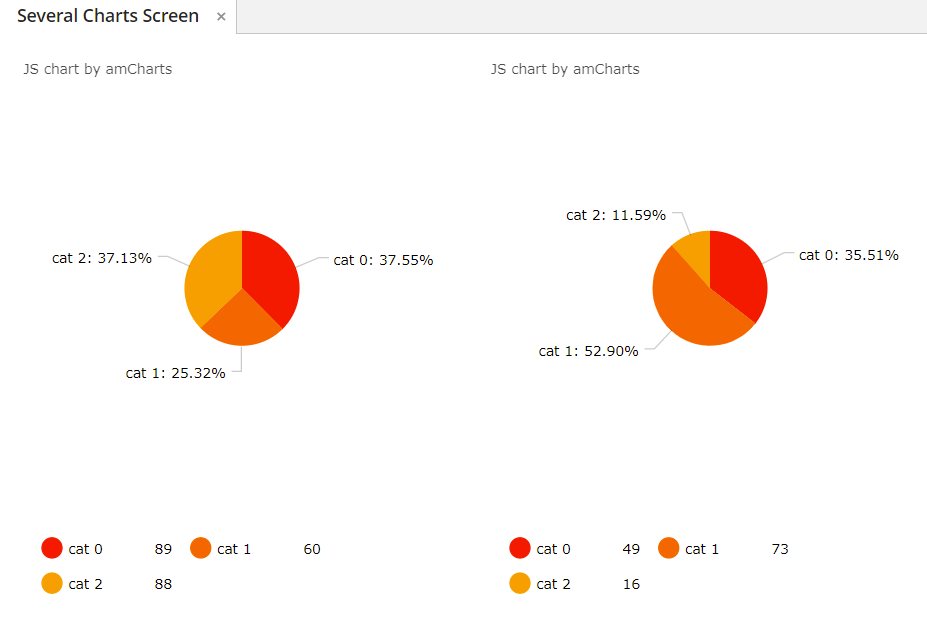
I’ve tried the following XML and charts are shown:
<layout expand="chartsBox">
    <hbox id="chartsBox" spacing="true" width="100%">
        <chart:pieChart id="pieChart1"
                        dataContainer="catValuesDc1"
                        height="100%"
                        titleField="category"
                        valueField="value"
                        width="100%">
            <chart:legend autoMargins="false"
                          marginRight="80"
                          markerType="CIRCLE"
                          position="BOTTOM"/>
            <chart:balloon fixedPosition="true"/>
        </chart:pieChart>
        <chart:pieChart id="pieChart2"
                        dataContainer="catValuesDc2"
                        height="100%"
                        titleField="category"
                        valueField="value"
                        width="100%">
            <chart:legend autoMargins="false"
                          marginRight="80"
                          markerType="CIRCLE"
                          position="BOTTOM"/>
            <chart:balloon fixedPosition="true"/>
        </chart:pieChart>
    </hbox>
</layout>
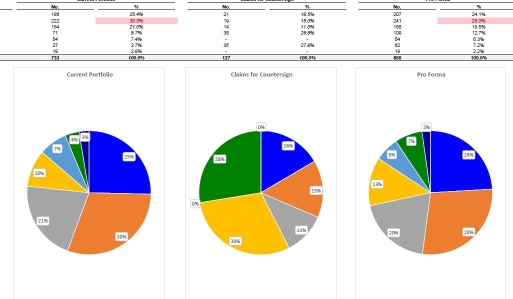
Hi, sure:
CollectionContainer:
    <collection id="portfolioAnalysisHerstellerDc" class="com.company.XXX.entity.PortfolioAnalysisHersteller">
        <view extends="portfolioAnalysisHersteller-view"/>
    </collection>> Blockquote
XML
	      <tab id="tabHersteller" caption="mainMsg://captHersteller" margin="false,true,true,true" >
            <vbox height="AUTO">
                <label value="Current and Pro Forma Portfolio Composititon" align="MIDDLE_CENTER"/>
                <label value="By Manufacturer"   align="MIDDLE_CENTER"/>
                <table id="tblByHersteller" dataContainer="portfolioAnalysisHerstellerDc" stylename="small no-vertical-lines no-horizontal-lines" width="100%"
                       aggregatable="true" showTotalAggregation="true">
                    <actions>
                        <action id="excel" type="excel"/>
                    </actions>
                    <columns>
                        <column id="hersteller" caption="mainMsg://captHersteller" width="200"/>
                        <column id="currentPortfolioAnzahl" caption="Current No."  width="120" align="CENTER">
                        </column>
                        <column id="currentPortfolioProzent" caption="Current  %" width="120" align="CENTER">
                        </column>
                        <column id="countersignPortfolioAnzahl" caption="Countersign No."  width="120" align="CENTER">
                        </column>
                        <column id="countersignPortfolioProzent" caption="Countersign %" width="120" align="CENTER">
                        </column>
                        <column id="proFormaPortfolioAnzahl" caption="ProForma No." width="120" align="CENTER">
                        </column>
                        <column id="proFormaPortfolioProzent" caption="ProForma %" width="120" align="CENTER">
                        </column>
                    </columns>
                    <rows/>
                    <buttonsPanel>
                        <button id="excelBtnHersteller" action="tblByHersteller.excel"/>
                    </buttonsPanel>
                </table>
                <hbox id="chartBox" spacing="true" width="100%">
                    <chart:pieChart id="pieChartCurrent"
                                    dataContainer="portfolioAnalysisHerstellerDc"
                                    height="100%"
                                    titleField="hersteller"
                                    valueField="currentPortfolioProzent"
                                    width="100%">
                        <chart:legend autoMargins="false"
                                      marginRight="80"
                                      markerType="CIRCLE"
                                      position="BOTTOM"/>
                        <chart:balloon fixedPosition="true"/>
                    </chart:pieChart>
                    <chart:pieChart id="pieChartCountersign"
                                    dataContainer="portfolioAnalysisHerstellerDc"
                                    height="100%"
                                    titleField="hersteller"
                                    valueField="countersignPortfolioProzent"
                                    width="100%">
                        <chart:legend autoMargins="false"
                                      marginRight="80"
                                      markerType="CIRCLE"
                                      position="BOTTOM"/>
                        <chart:balloon fixedPosition="true"/>
                    </chart:pieChart>
                    <chart:pieChart id="pieChartProForma"
                                    dataContainer="portfolioAnalysisHerstellerDc"
                                    height="100%"
                                    titleField="hersteller"
                                    valueField="proFormaPortfolioProzent"
                                    width="100%">
                        <chart:legend autoMargins="false"
                                      marginRight="80"
                                      markerType="CIRCLE"
                                      position="BOTTOM"/>
                        <chart:balloon fixedPosition="true"/>
                    </chart:pieChart>
                </hbox>
            </vbox>
        </tab>
Controller Definition:
@Inject
private CollectionContainer<PortfolioAnalysisHersteller> portfolioAnalysisHerstellerDc;
Controller ControllerContainer:
portfolioAnalysisHerstellerDc.setItems(portfolioAnalysisService.getResultByHerstellerFor(mParms));
Collection contaniner is filled correctly.
Since <vbox> has the AUTO value charts are collapsed. You can define height of charts in pixels or set 100% height to the <vbox> and expand chartBox:
<vbox height="100%" expand="chartBox">
Sorry, that hasn’t any effect.
Soved. I tried without any with/height parm at all and it was shown.
I’m doing the fine-tuning now.
However, to play with the display parms was the right inspiration.
Thanks.