Hi,
How to resize the line chart and how to display two y axis in line chart(left side and right side)
Thanks,
Mallik
Hi,
How to resize the line chart and how to display two y axis in line chart(left side and right side)
Thanks,
Mallik
Hi,
Could you please describe in more details your needs. Do you want to resize chart programmatically or via a chart UI? Do you want to divide the chart into two halves or just have two value axis on opposite sides?
Regards,
Gleb
The example of adding several value axes is shown in this topic. The main point is that each value axis element has the position attribute.
To zoom in/out a chart programmatically use on if the SerialChart API methods: zoomOut(), zoomOutValueAxes(), zoomOutValueAxis(), zoomToDates(), zoomToIndexes(), zoomValueAxisToValues().
Regards,
Gleb
Thanks Gleb,
Need programmatically resize andtwo value axis on opposite sides
Hi Gleb,
Multiple y axis is working but issue is,for on axis the line separator is 500 and for other 1000(means for one axis i have 10 coordinates and for other have 5 coordinates). How to fix this issue.
Please check the reference file.
Regards,
Mallik
Hi,
I would suggest you the following:
Regards,
Gleb
Thanks Gleb,
How do i set these values from the controller to chart.
I am using the following code
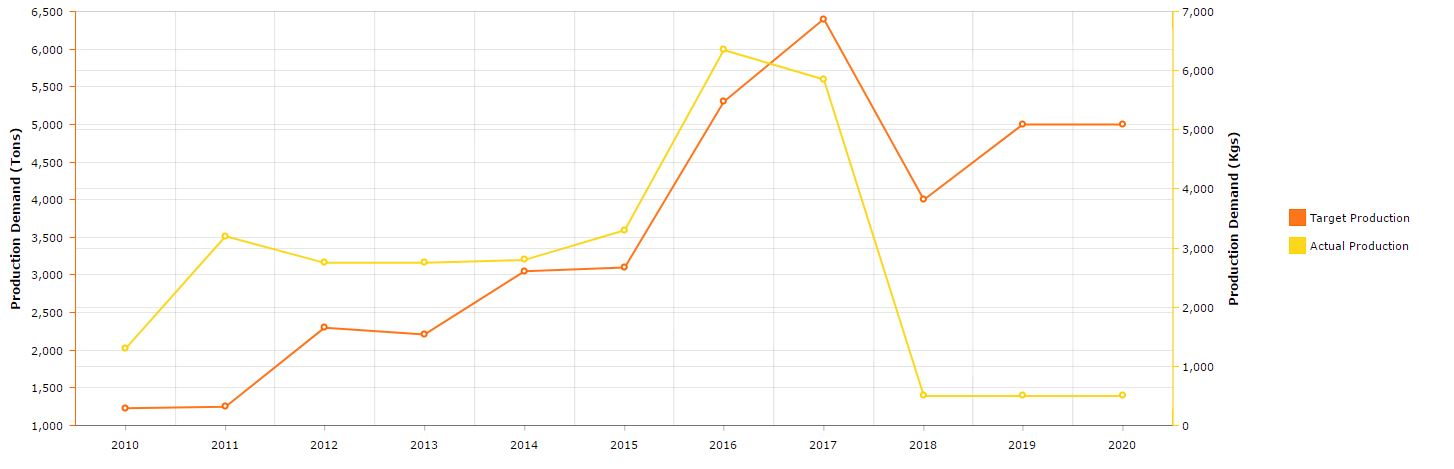
<chart:valueAxes id="planValueAxes">
                    <chart:axis id="v1"
                                autoGridCount="true"
                                axisAlpha="1"
                                axisColor="#FF6600"
                                <b>maximum="800"</b>
                                position="LEFT"
                                stackType="BOX_3D"
                                title="Production Demand (Tons)"/>
                    <chart:axis id="v2"
                                autoGridCount="true"
                                axisAlpha="1"
                                axisColor="#FCD202"
                                <b>maximum="8000"</b>
                                position="RIGHT"
                                stackType="BOX_3D"
                                title="Production Demand (Kgs)"/>
                </chart:valueAxes>
I want to set this maximum value from the controller using some calculations.Please help me here
Regards,
Mallik
Hi,
You can inject your line chart inside screen controller, obtain a list of ValueAxis objects and set needed values to them, e.g.
@Inject
private SerialChart lineChart;

@Override
public void init(Map<String, Object> params) {
	lineChart.getValueAxes().forEach(valueAxis -> valueAxis.setMaximum(800.0));
}
Regards,
Gleb