CUBA charts display subsystem implementation is based on AmCharts library. This library provides demos for all charts. Each online-demo has a source where the chart displays as a JSON object.
In CUBA there are analogs for the most of the JSON parameters. Each chart type has its own set of attributes and methods, which replicate the functionality of the corresponding charts from AmCharts library.
3D Bar Chart
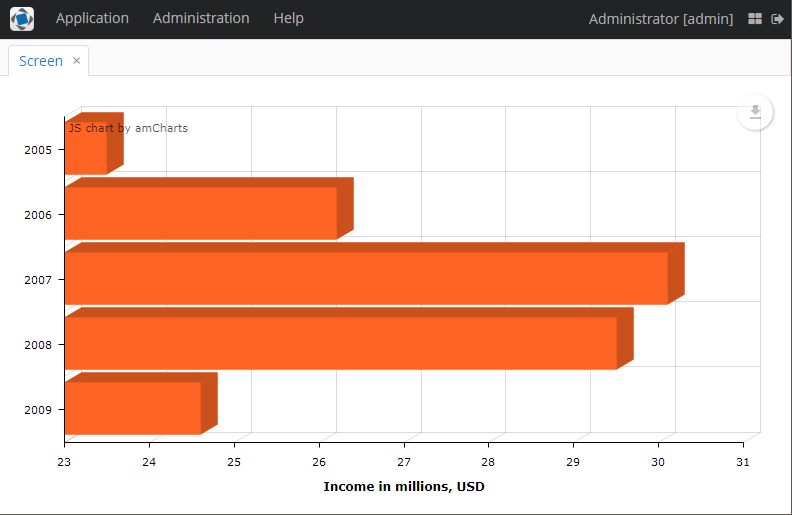
Let’s see step-by-step how to include the 3D Bar Chart. Click the View Demo Source to see the JSON of the chart.
The parameter "type": "serial" means that we have to add the Serial Chart component to the screen:
<chart:serialChart height="100%"
                   width="100%"/>
Simple parameters such as "angle", "rotate" and "categoryField" added as an attributes of the chart:serialChart element:
<chart:serialChart height="100%"
                   width="100%"
                   depth3D="20"
                   angle="30"
                   rotate="true"
                   categoryField="year">
If the property described as an array of properties or objects with properties it will be added to the CUBA chart as a new XML attributes. For example, "graphs" property will be added as follows:
<chart:graphs>
   <chart:graph balloonText="Income in [[category]]:[[value]]"
                fillAlphas="1"
                lineAlpha="0.2"
                title="Income"
                type="COLUMN"
                valueField="income"/>
</chart:graphs>
In the end, the chart will have the following structure:
<chart:serialChart height="100%"
                   width="100%"
                   depth3D="20"
                   angle="30"
                   rotate="true"
                   categoryField="year">
    <chart:valueAxes>
       <chart:axis title="Income in millions, USD"/>
    </chart:valueAxes>
    <chart:graphs>
       <chart:graph balloonText="Income in [[category]]:[[value]]"
                    fillAlphas="1"
                    lineAlpha="0.2"
                    title="Income"
                    type="COLUMN"
                    valueField="income"/>
    </chart:graphs>
    <chart:categoryAxis gridPosition="START" fillAlpha="0.05" position="LEFT"/>
    <chart:export enabled="true"/>
</chart:serialChart>
Quick charts prototyping
It is a common situation when configuring a chart that there is no data enough to check if it looks good with different data sets.
The chart:data option is useful for quick prototyping of charts. This element and its nested item elements enable you to set key-value pairs of data directly in the XML descriptor of the chart. Note that for all types of values (except for string) it is required to specify a particular type.
So, let’s add the data to the chart and see, how it works:
<chart:data>
   <chart:item>
      <chart:property name="year" value="2005" type="int"/>
      <chart:property name="income" value="23.5" type="double"/>
   </chart:item>
   <chart:item>
      <chart:property name="year" value="2006" type="int"/>
      <chart:property name="income" value="26.2" type="double"/>
   </chart:item>
   <chart:item>
      <chart:property name="year" value="2007" type="int"/>
      <chart:property name="income" value="30.1" type="double"/>
   </chart:item>
   <chart:item>
      <chart:property name="year" value="2008" type="int"/>
      <chart:property name="income" value="29.5" type="double"/>
   </chart:item>
   <chart:item>
      <chart:property name="year" value="2009" type="int"/>
      <chart:property name="income" value="24.6" type="double"/>
   </chart:item>
</chart:data>
Another one useful trick is that you can easily change the data without stopping the application. The Hot Deploy technology helps to apply project changes to the running application immediately without the need to restart the application server.
3D Donut Chart
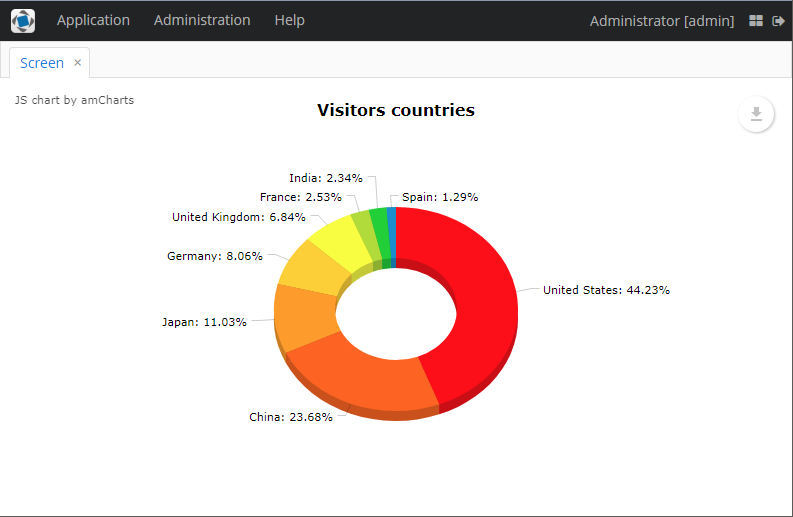
Let’s add one more graph - the 3D Donut Chart. Click the View Demo Source to see the JSON of the chart.
This graph has another type - pie, which means that at this time we will configure the Pie Chart component.
<chart:pieChart height="100%"
width="100%"
valueField="visits"
titleField="country"
startEffect="ELASTIC"
startDuration="2"
labelRadius="15"
innerRadius="50%"
depth3D="10"
angle="15"
balloonText="[[title]]<br><span style='font-size:14px'<b>[[value]]</b> ([[percents]]%)</span>">
<chart:titles>
<chart:title text="Visitors countries" size="16"/>
</chart:titles>
<chart:export enabled="true"/>
</chart:pieChart>
Use the following data for quick prototyping:
<chart:data>
   <chart:item>
      <chart:property name="country" value="United States"/>
      <chart:property name="visits" value="7252" type="int"/>
   </chart:item>
   <chart:item>
      <chart:property name="country" value="China"/>
      <chart:property name="visits" value="3882" type="int"/>
   </chart:item>
   <chart:item>
      <chart:property name="country" value="Japan"/>
      <chart:property name="visits" value="1809" type="int"/>
   </chart:item>
   <chart:item>
      <chart:property name="country" value="Germany"/>
      <chart:property name="visits" value="1322" type="int"/>
   </chart:item>
   <chart:item>
      <chart:property name="country" value="United Kingdom"/>
      <chart:property name="visits" value="1122" type="int"/>
   </chart:item>
   <chart:item>
      <chart:property name="country" value="France"/>
      <chart:property name="visits" value="414" type="int"/>
   </chart:item>
   <chart:item>
      <chart:property name="country" value="India"/>
      <chart:property name="visits" value="384" type="int"/>
   </chart:item>
   <chart:item>
      <chart:property name="country" value="Spain"/>
      <chart:property name="visits" value="211" type="int"/>
   </chart:item>
</chart:data>
Once all above mentioned steps are taken, start your application and open the required screen to check that the chart is displayed