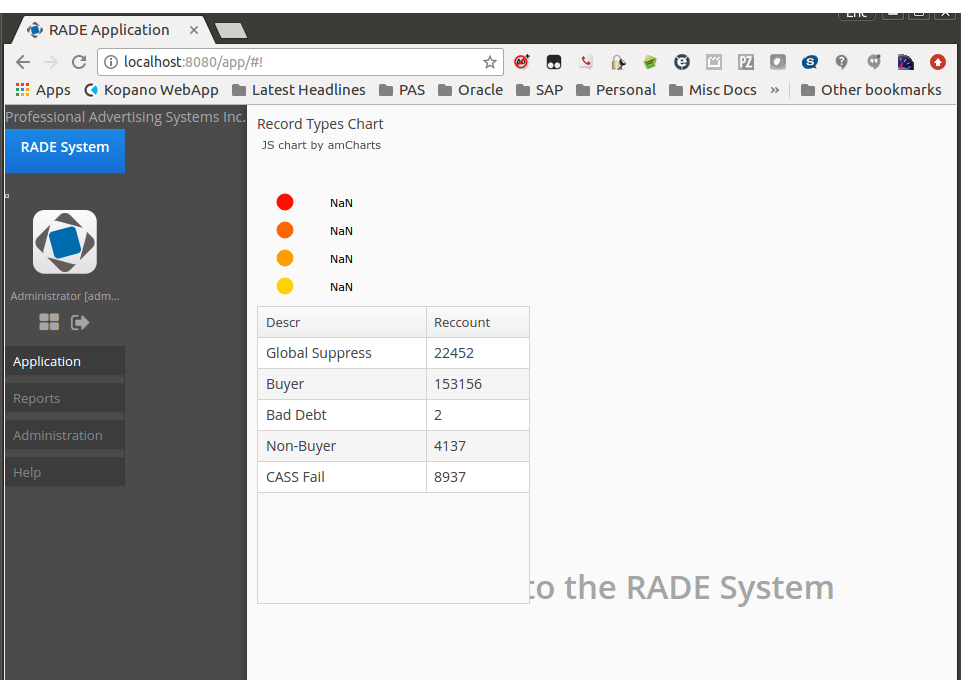
I am trying to get my first chart (a piechart) to work. I have the following XML defined (with the sidemenu/table omitted). There is obviously data because it is displayed in the table, but there is no pie chart and the legend is all “NaN” and no description. I have tried expanding the size on the piechart but it is still empty. What am I doing wrong?
<dsContext>
<valueCollectionDatasource id="customersRtypeDs">
<query>
<![CDATA[select coalesce(c.descr,'Unknown') as descr, count(e) as reccount
from rade$Customer e left join rade$CodeControl c
where e.rtype = c.id.code
and c.id.recType = 'T'
and c.status = 'A'
group by c.descr]]>
</query>
<properties>
<property datatype="string"
name="descr"/>
<property datatype="int"
name="reccount"/>
</properties>
</valueCollectionDatasource>
</dsContext>
.
.
.
<chart:pieChart id="pieRecTypes"
caption="Record Types Chart"
datasource="customersRtypeDs"
height="200px"
titlefield="descr"
valuefield="reccount"
width="200px">
<chart:legend autoMargins="false"
marginRight="80"
markerType="CIRCLE"
position="BOTTOM"/>
</chart:pieChart>