I have few questions:
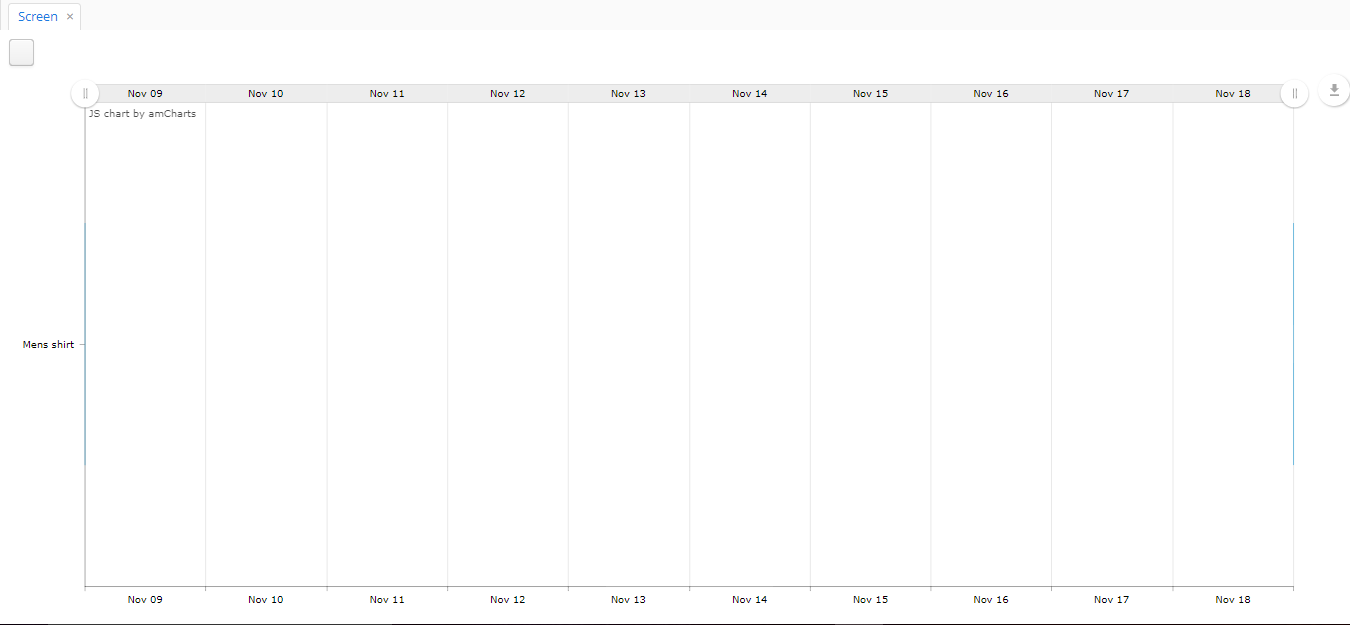
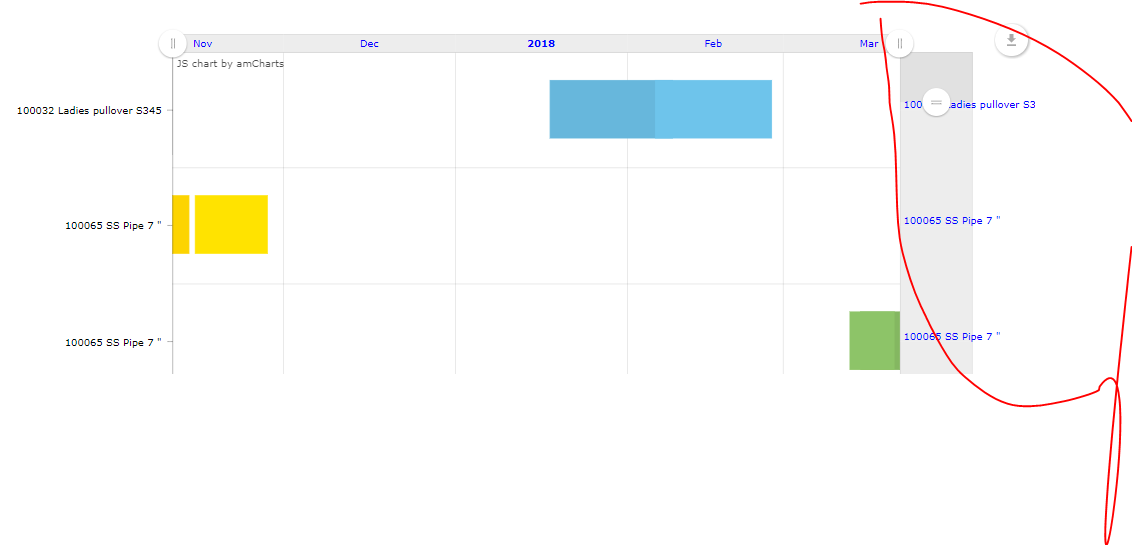
- I have a GanttChart where the bar not displayed properly (very tiny bars) and date starts:
Here is the display:
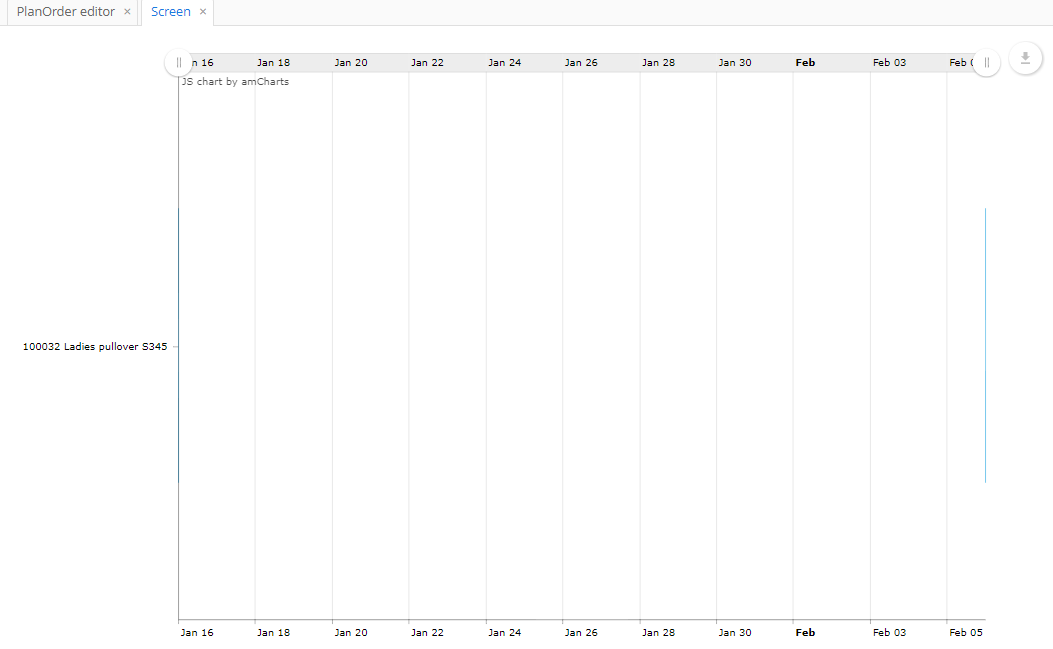
Here is the xml
<layout>
<chart:ganttChart id="ganttChart"
additionalSegmentFields="operation"
balloonDateFormat="JJ:NN"
brightnessStep="7"
categoryField="material"
columnWidth="0.5"
datasource="planOrdersDs"
endDateField="operPlanStartDate"
height="100%"
marginRight="70"
mouseWheelScrollEnabled="true"
period="DAYS"
rotate="true"
segmentsField="planOrderOperations"
startDate="2018-01-01"
startDateField="operPlanStartDate"
theme="LIGHT"
width="100%">
<chart:graph balloonText="<strong>[[operation]]</strong>: [[open]] [[value]]"
fillAlphas="1"/>
<chart:valueAxis type="DATE"/>
<chart:valueScrollbar autoGridCount="true"
color="BLACK"/>
<chart:chartCursor cursorAlpha="0"
cursorColor="#55bb76"
fullWidth="true"
valueBalloonsEnabled="false"
valueLineAlpha="0.5"
valueLineBalloonEnabled="true"
valueLineEnabled="true"
valueZoomable="true"
zoomable="false"/>
<chart:export/>
</chart:ganttChart>
</layout>
-
If I change the period from DAYS to WEEKS or MONTHS, nothing changed. How can I display Gantt Chart in Week or Month period buckets?
-
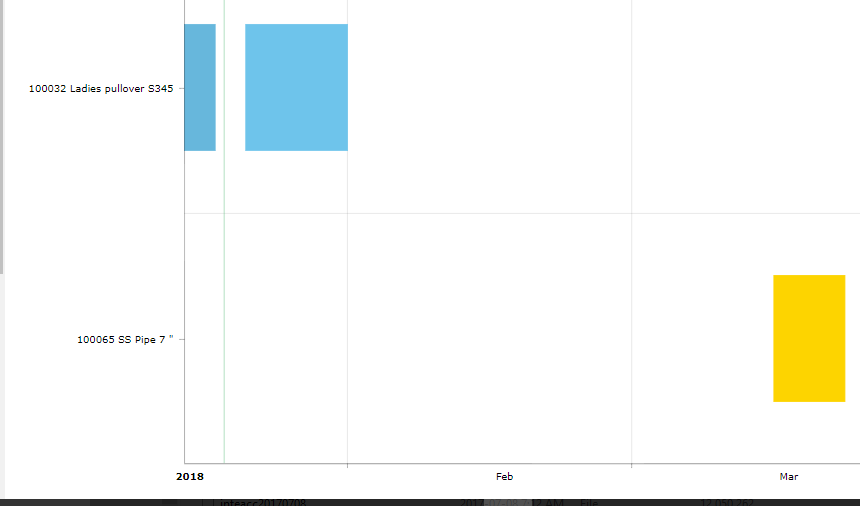
I want to display specific horizon say, 36 periods (weeks).
Thanks for your help.
