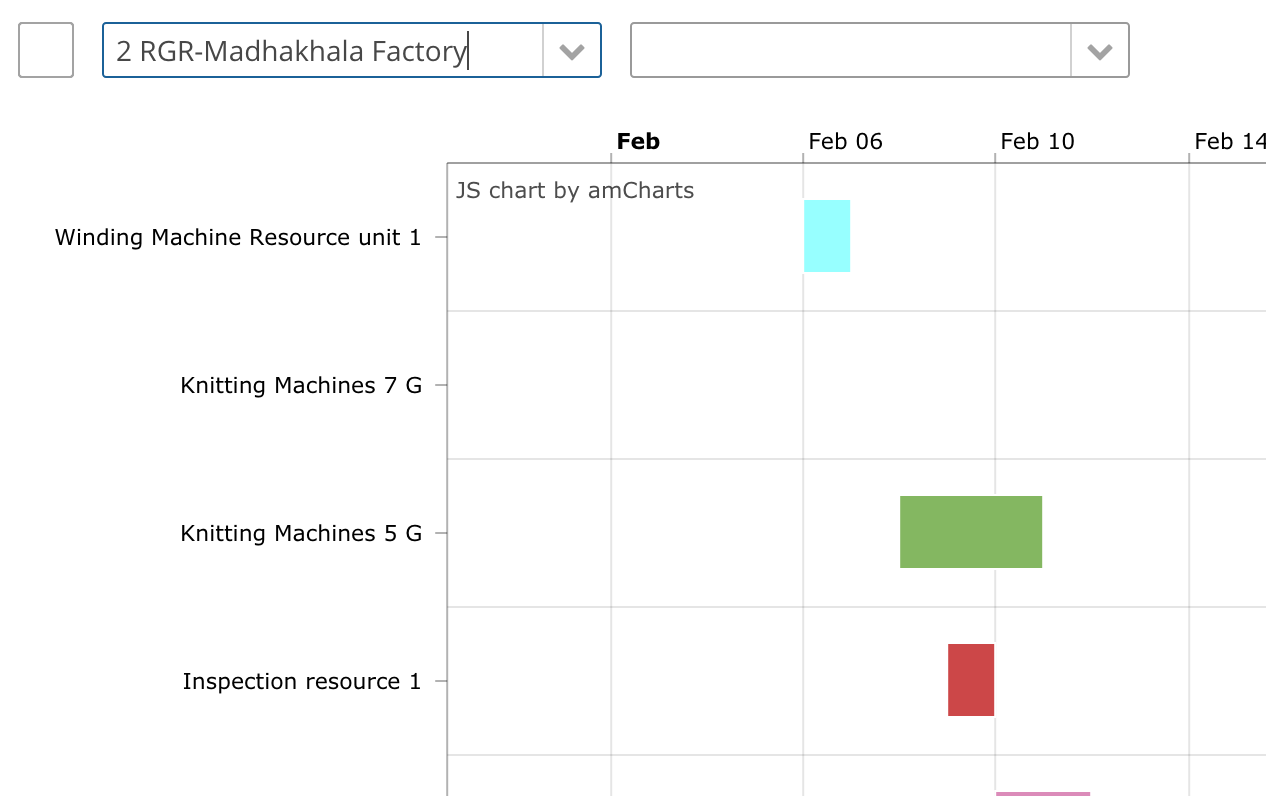
when I use startDate, the gantChart shows the data but not starting from the date I have selected as follows:
However, as I want to use the date from the datasource, i removed the startDate field and used startDateField instead as follows but it doesn’t show the Gantt chart content.
<chart:ganttChart id="ganttChart"
additionalSegmentFields="planOrder"
balloonDateFormat="JJ:NN"
brightnessStep="7"
categoryField="resource"
columnWidth="0.5"
datasource="productionOperationResourceGanttsDs"
endDateField="operFinishDate"
marginRight="70"
period="WEEKS"
rotate="true"
segmentsField="productionOperationResourceOrderDate"
startDateField="operStartDate"
theme="LIGHT"
width="100%">
<chart:graph balloonText="<strong>[[planOrder]]</strong>: [[open]] - [[value]]"
fillAlphas="1"
lineAlpha="1"
lineColor="WHITE"/>
<chart:valueAxis maximum="31"
minimum="7"
position="TOP"
type="DATE"/>
<chart:valueScrollbar autoGridCount="true"
color="BLACK"/>
<chart:chartCursor cursorAlpha="0"
cursorColor="#55bb76"
fullWidth="true"
valueBalloonsEnabled="false"
valueLineAlpha="0.5"
valueLineBalloonEnabled="true"
valueLineEnabled="true"
valueZoomable="true"
zoomable="false"/>
<chart:export/>
</chart:ganttChart>