Hello, I’m trying to build a gantt chart to show the day scheduling of some resources.
The hours day range is from 6:00 to 19:00
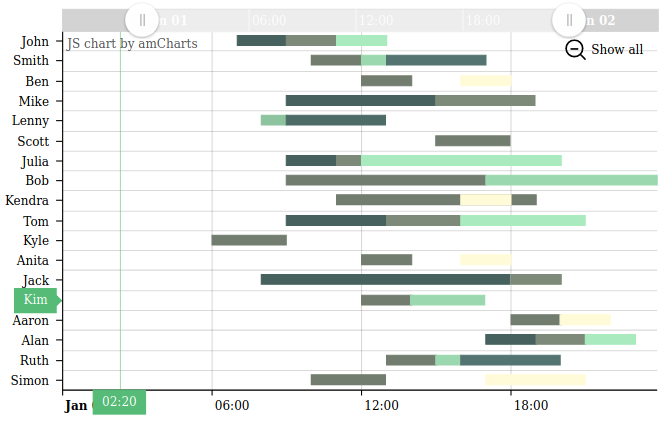
If the chart width is too small and cannot view all hours numbers, the cursor balloon (on time axis) shows time:
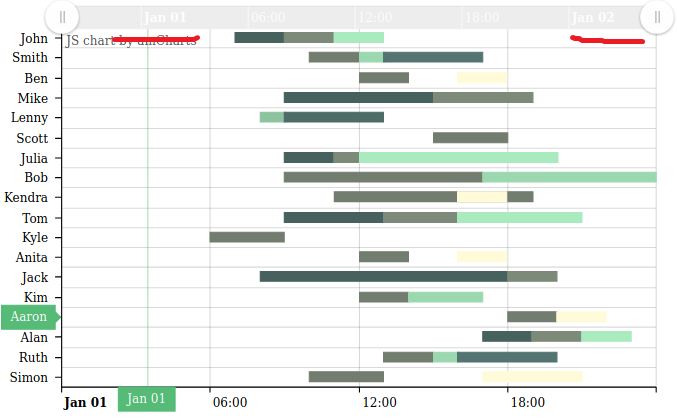
Instead, if it is wide enough to show all hours, cursor shows the date:
In my example “Feb 27”
How can always show the time?
I’m using 7.1.3 Platform version.
Thanks to everyone
In this case the cursor show only date, but only if chart size is wide enough to show all hours numbers (6.00 - 7.00 - 8.00 …).
If I reduce my browser window, and hours are showed by step (6.00 - 9.00 - 12.00 …) magically begins to display the time instead of date.
I think this is a little bug.
Sorry for the misunderstanding, I reproduced this problem. Probably, it is not a bug but the actual behavior of the chart. If Gantt shows values more than the defined range (e.g. “minimum:”: 0, “maximum”: 24 and Gantt shows two days) it will not show time values.
Gantt over range
But if we set range less or equal to defined it will work fine:
Gantt equal range
When we don’t use these attributes, Gantt automatically adjusts range.