Gantt Chart - X-Axis scale display

Hi
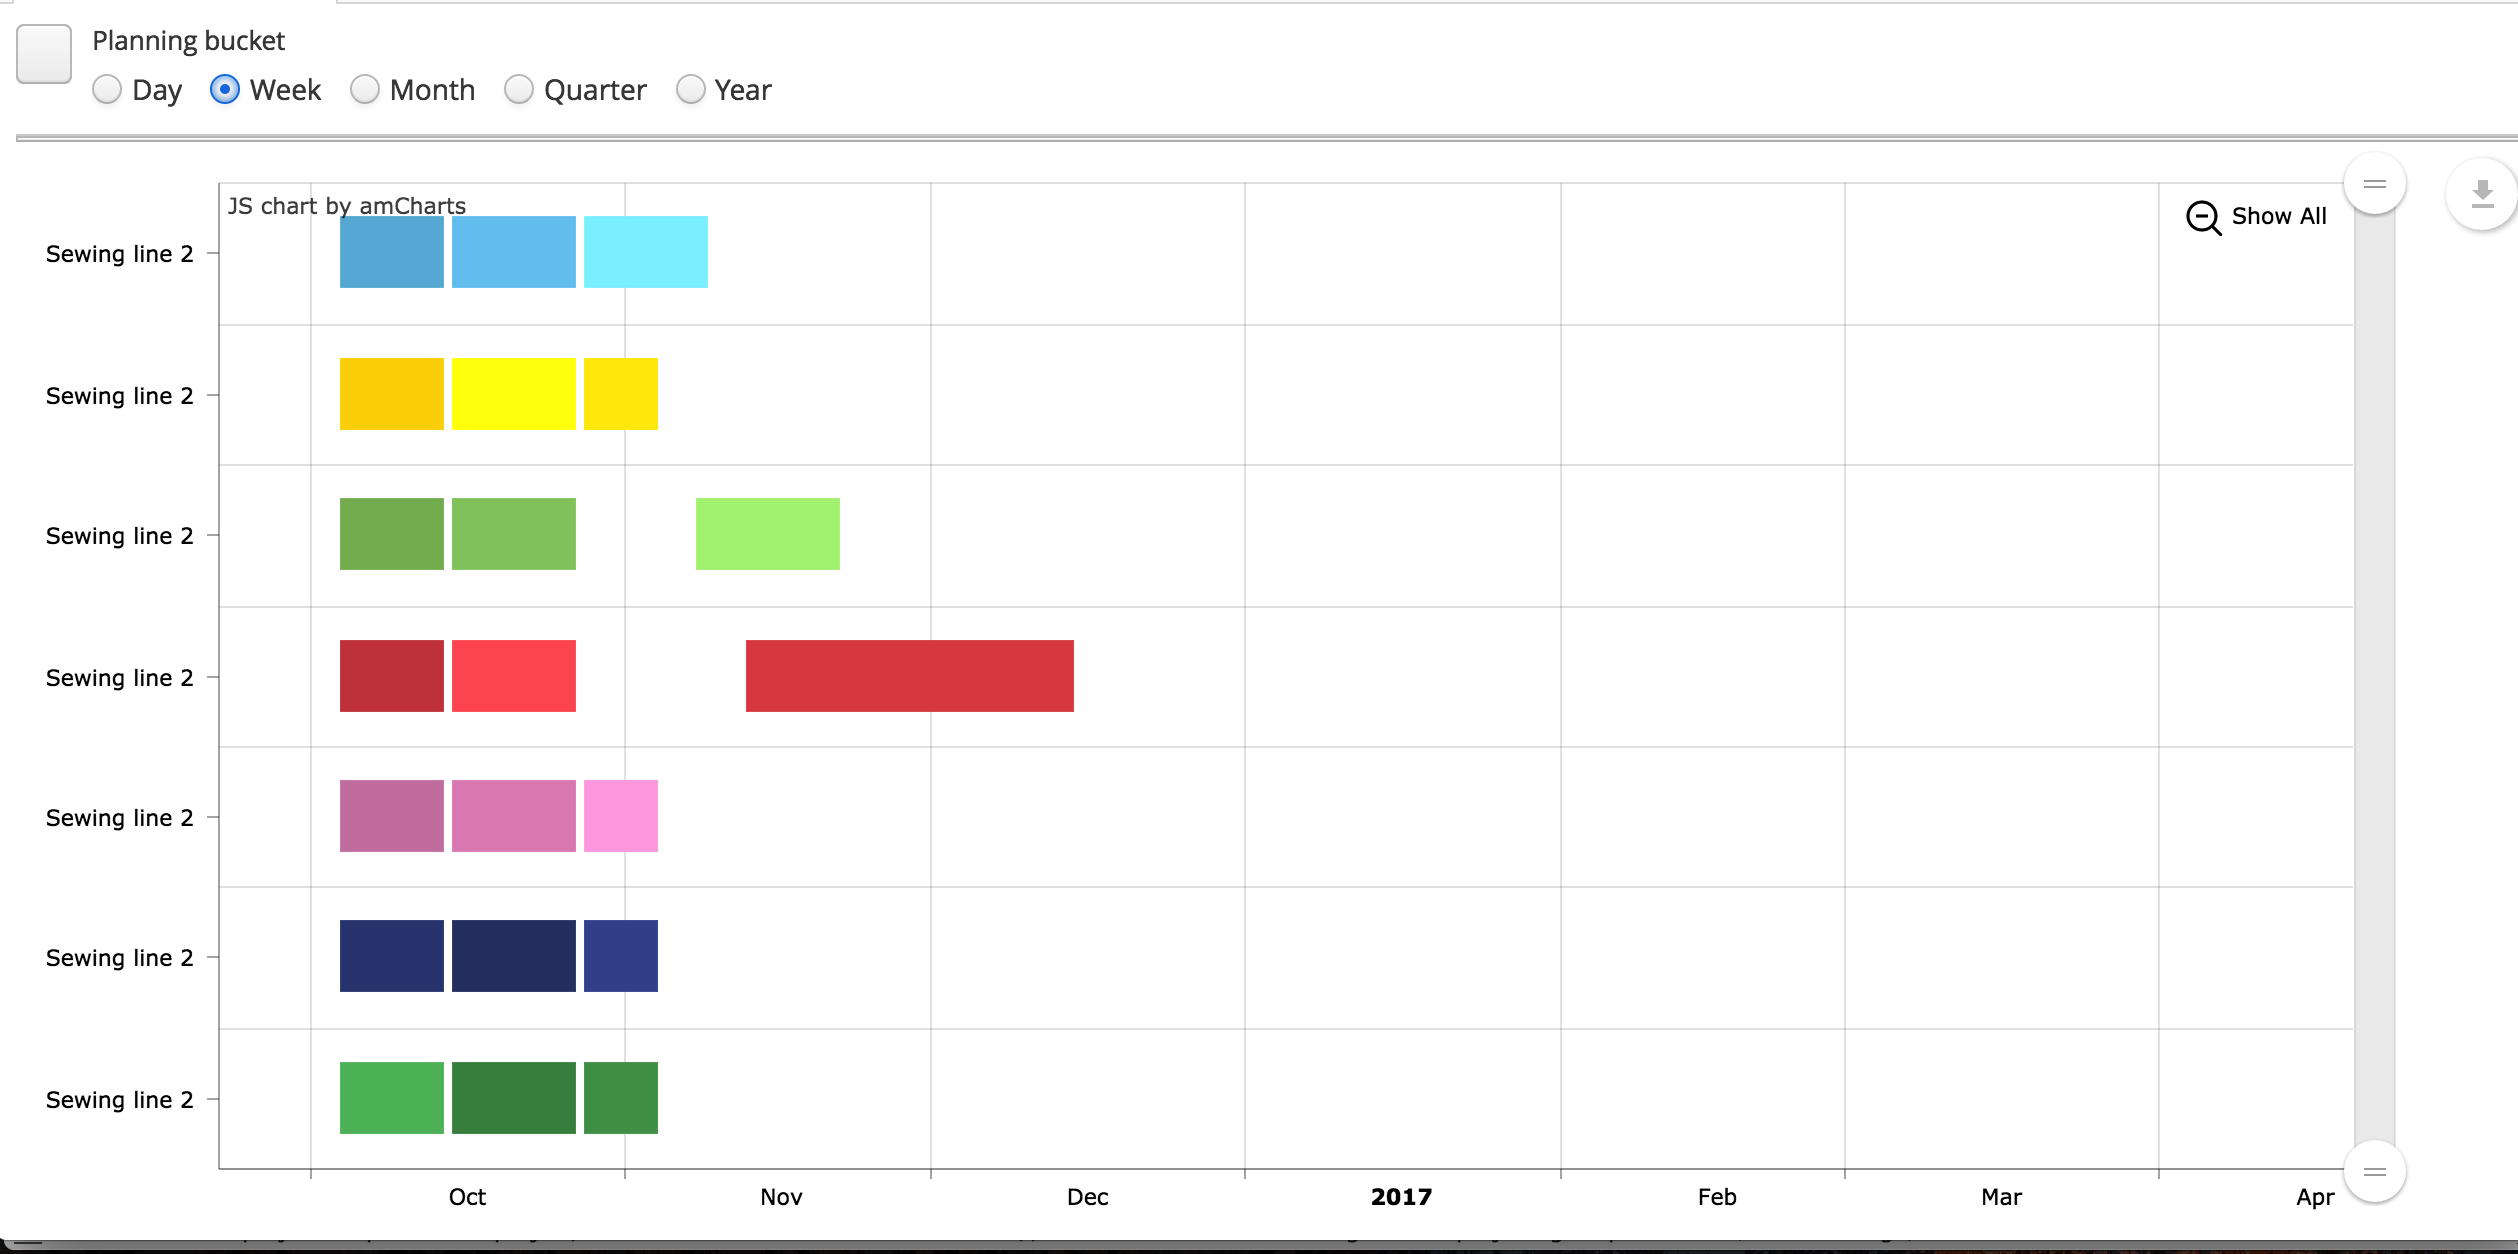
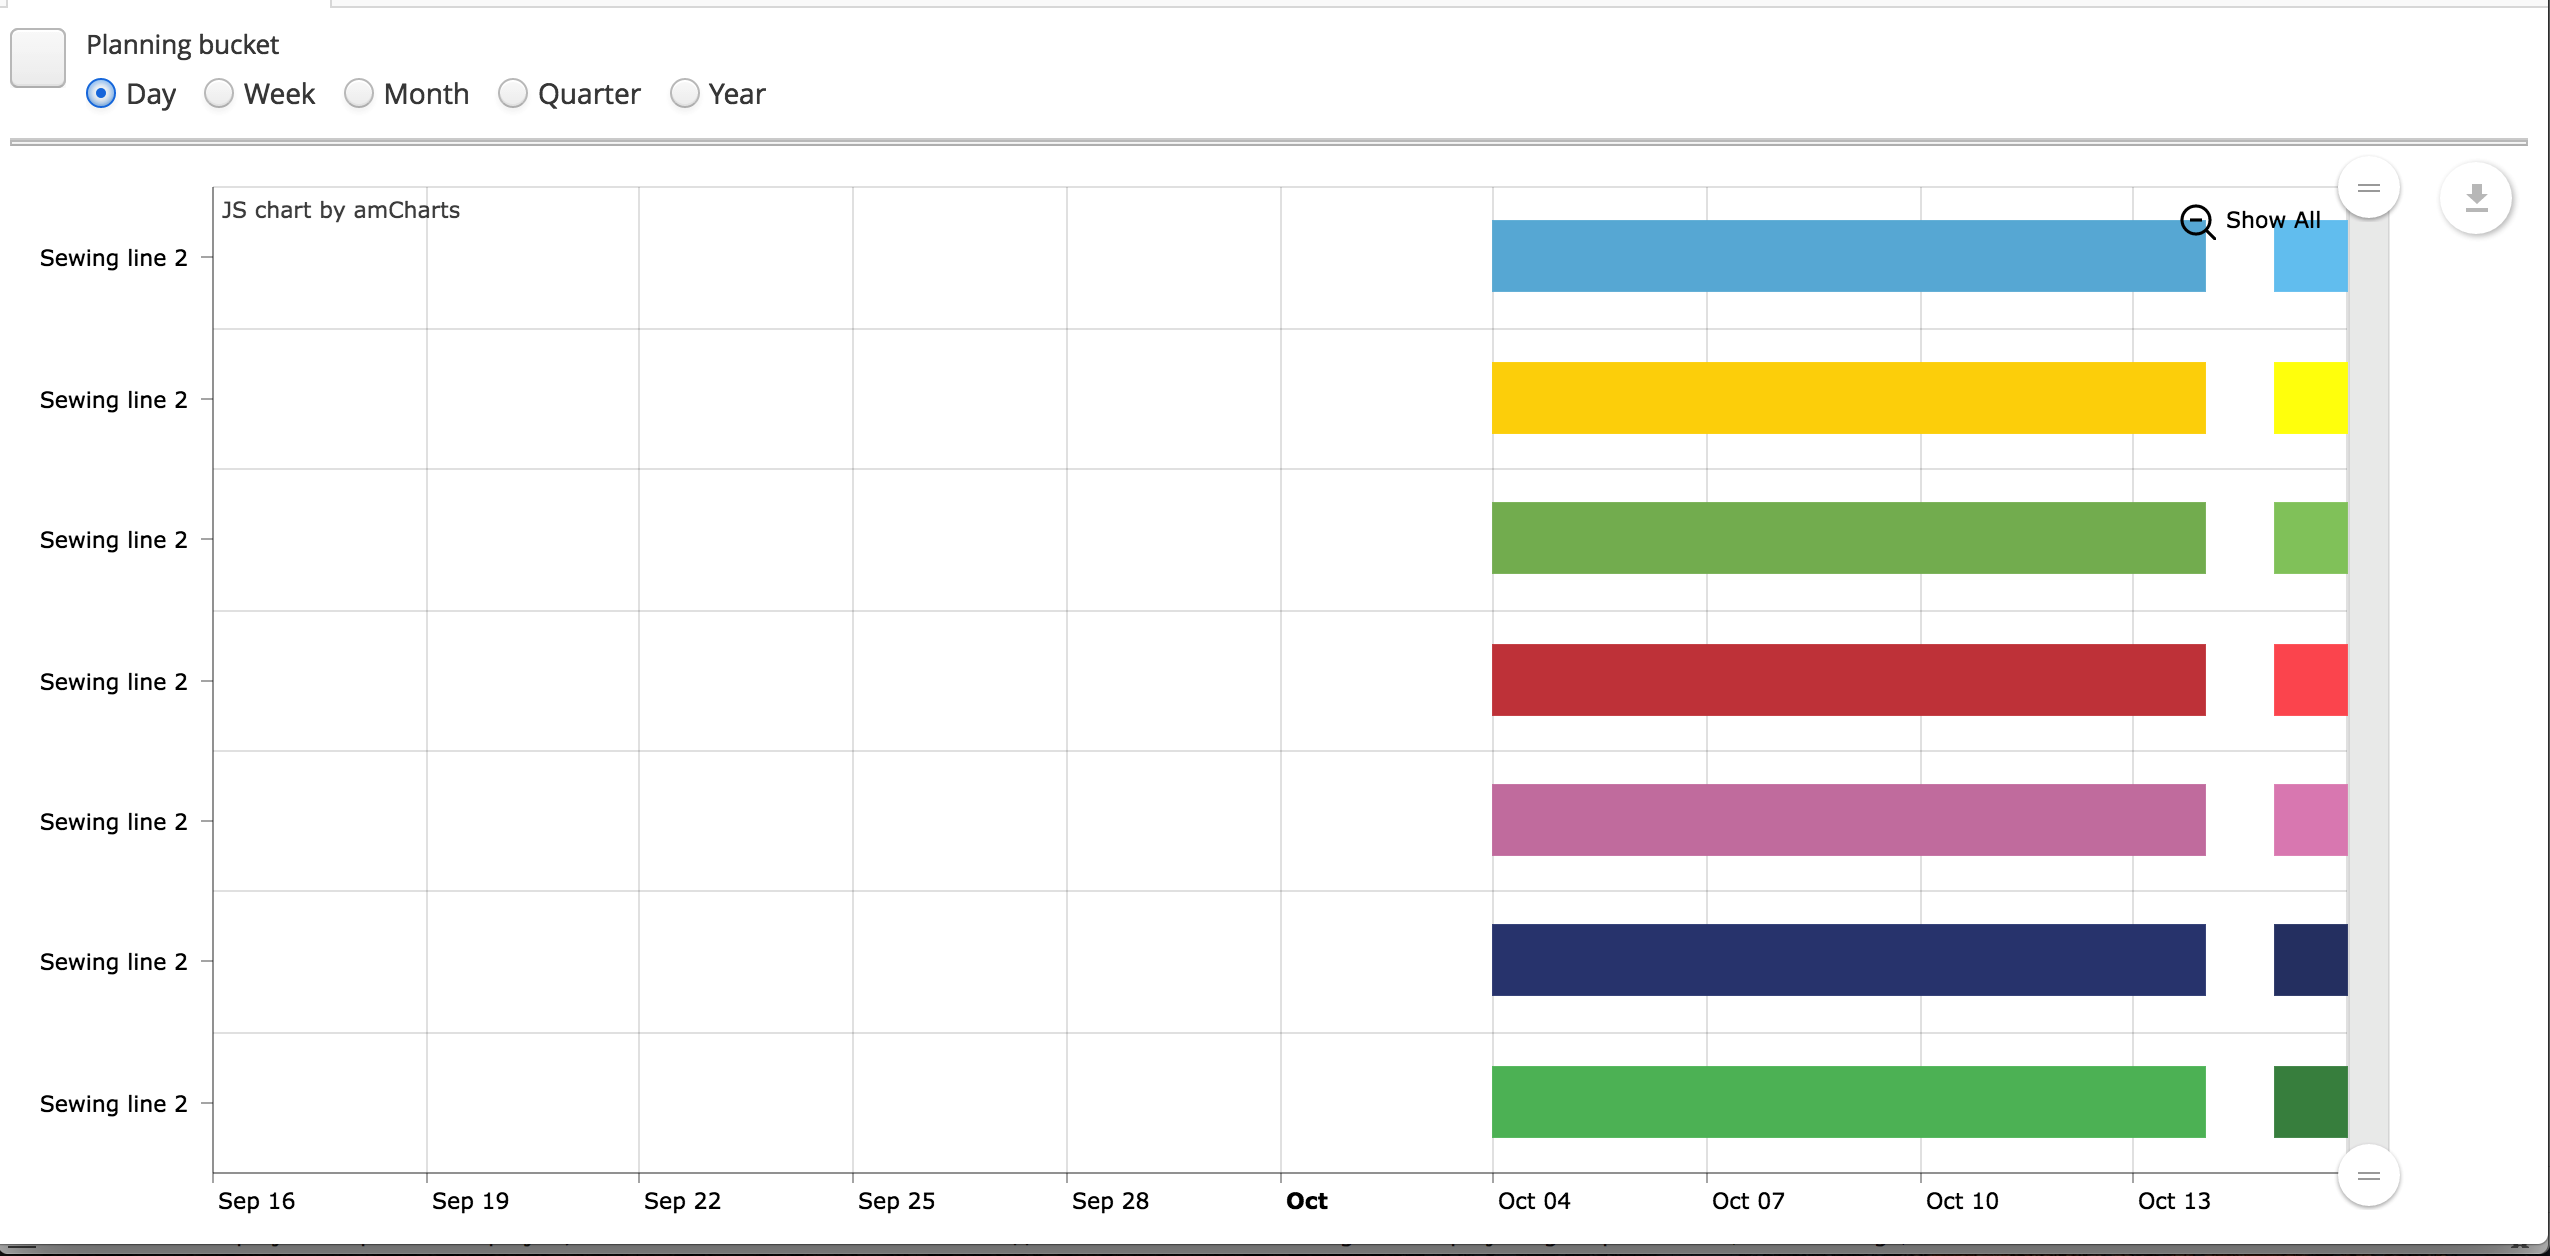
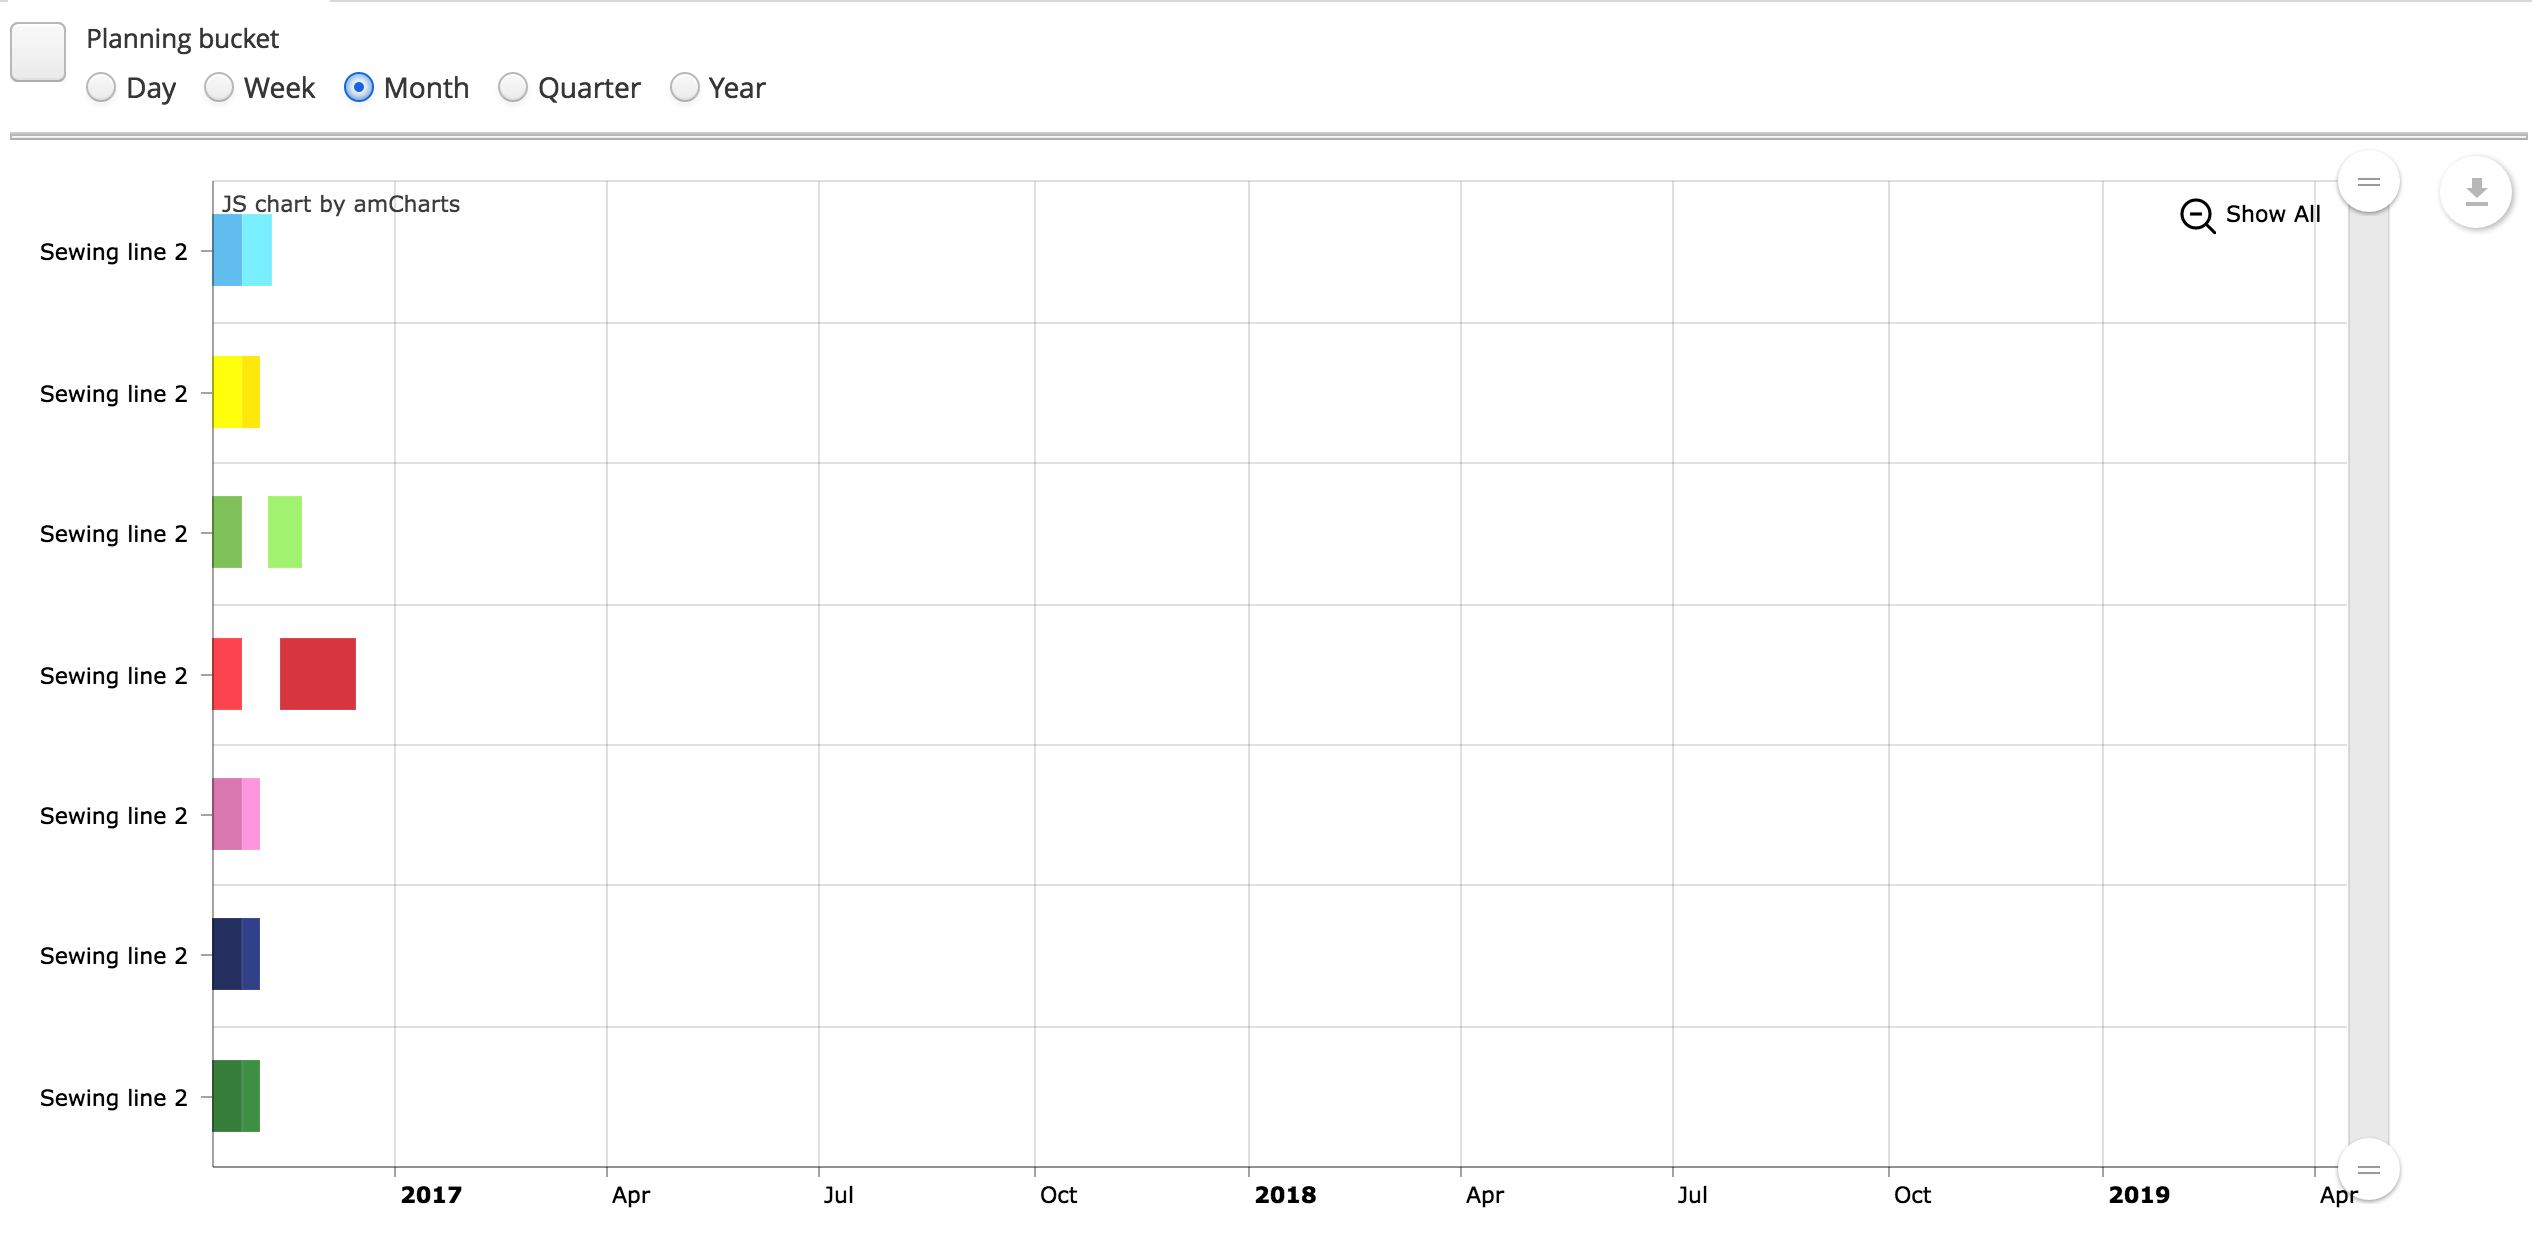
I have a gantt Chart where i have options to display in Daily, Weekly, Monthly etc. I have couple of questions in this regard.

  1. Is there any period option for Quarter ? (like WW for Week, MM for Month…)

  2. When I display in Daily, Weekly, Monthly, Yearly - not all period names are displayed in X axis. It shows skipping some.
    a) How can I display all of them without Skipping?
    b) I have used startDate of the chart but how can I specify end date or number of buckets to display?
    c) Is it possible activating scroll-bar (Horizontal)?

I have attached few screen-print where you will see my observation to the above comments.

Snip20161010_1

Snip20161010_2

Snip20161010_3

Hi,

  1. There is no option for Quarter
  2. You can use valueScrollbar option of a GanttChart to show the horizontal scrollbar, but there is no option to zoom it to particular dates:

<chart:ganttChart id="productionChart"
                  dataDateFormat="YYYY-MM-DD JJ:NN:SS:QQQ"
                  datasource="productionLinesDs"
                  height="250px"
                  width="100%"
                  marginRight="70"
                  period="DD"
                  columnWidth="0.5"
                  brightnessStep="7"
                  rotate="true"
                  categoryField="title"
                  segmentsField="stages"
                  colorField="color"
                  startDateField="startDate"
                  endDateField="endDate"
                  additionalSegmentFields="title">
    <chart:valueAxis type="DATE"/>
    <chart:graph fillAlphas="0.85"/>
    <chart:valueScrollbar autoGridCount="true"/>
    <chart:chartCursor zoomable="false"
                       valueZoomable="true"/>
</chart:ganttChart>

We will investigate options of AmCharts GanttChart for on-the-fly zooming, and if it is possible, then we will implement CUBA API for this feature.