Entity 1 (ScientificPaper) : Scientific Paper with Start & End Date and other attributes
Entity 2 (AssignedAuthors) : List of Authors Assigned to Scientific Paper with different Start & End Dates based on assignment
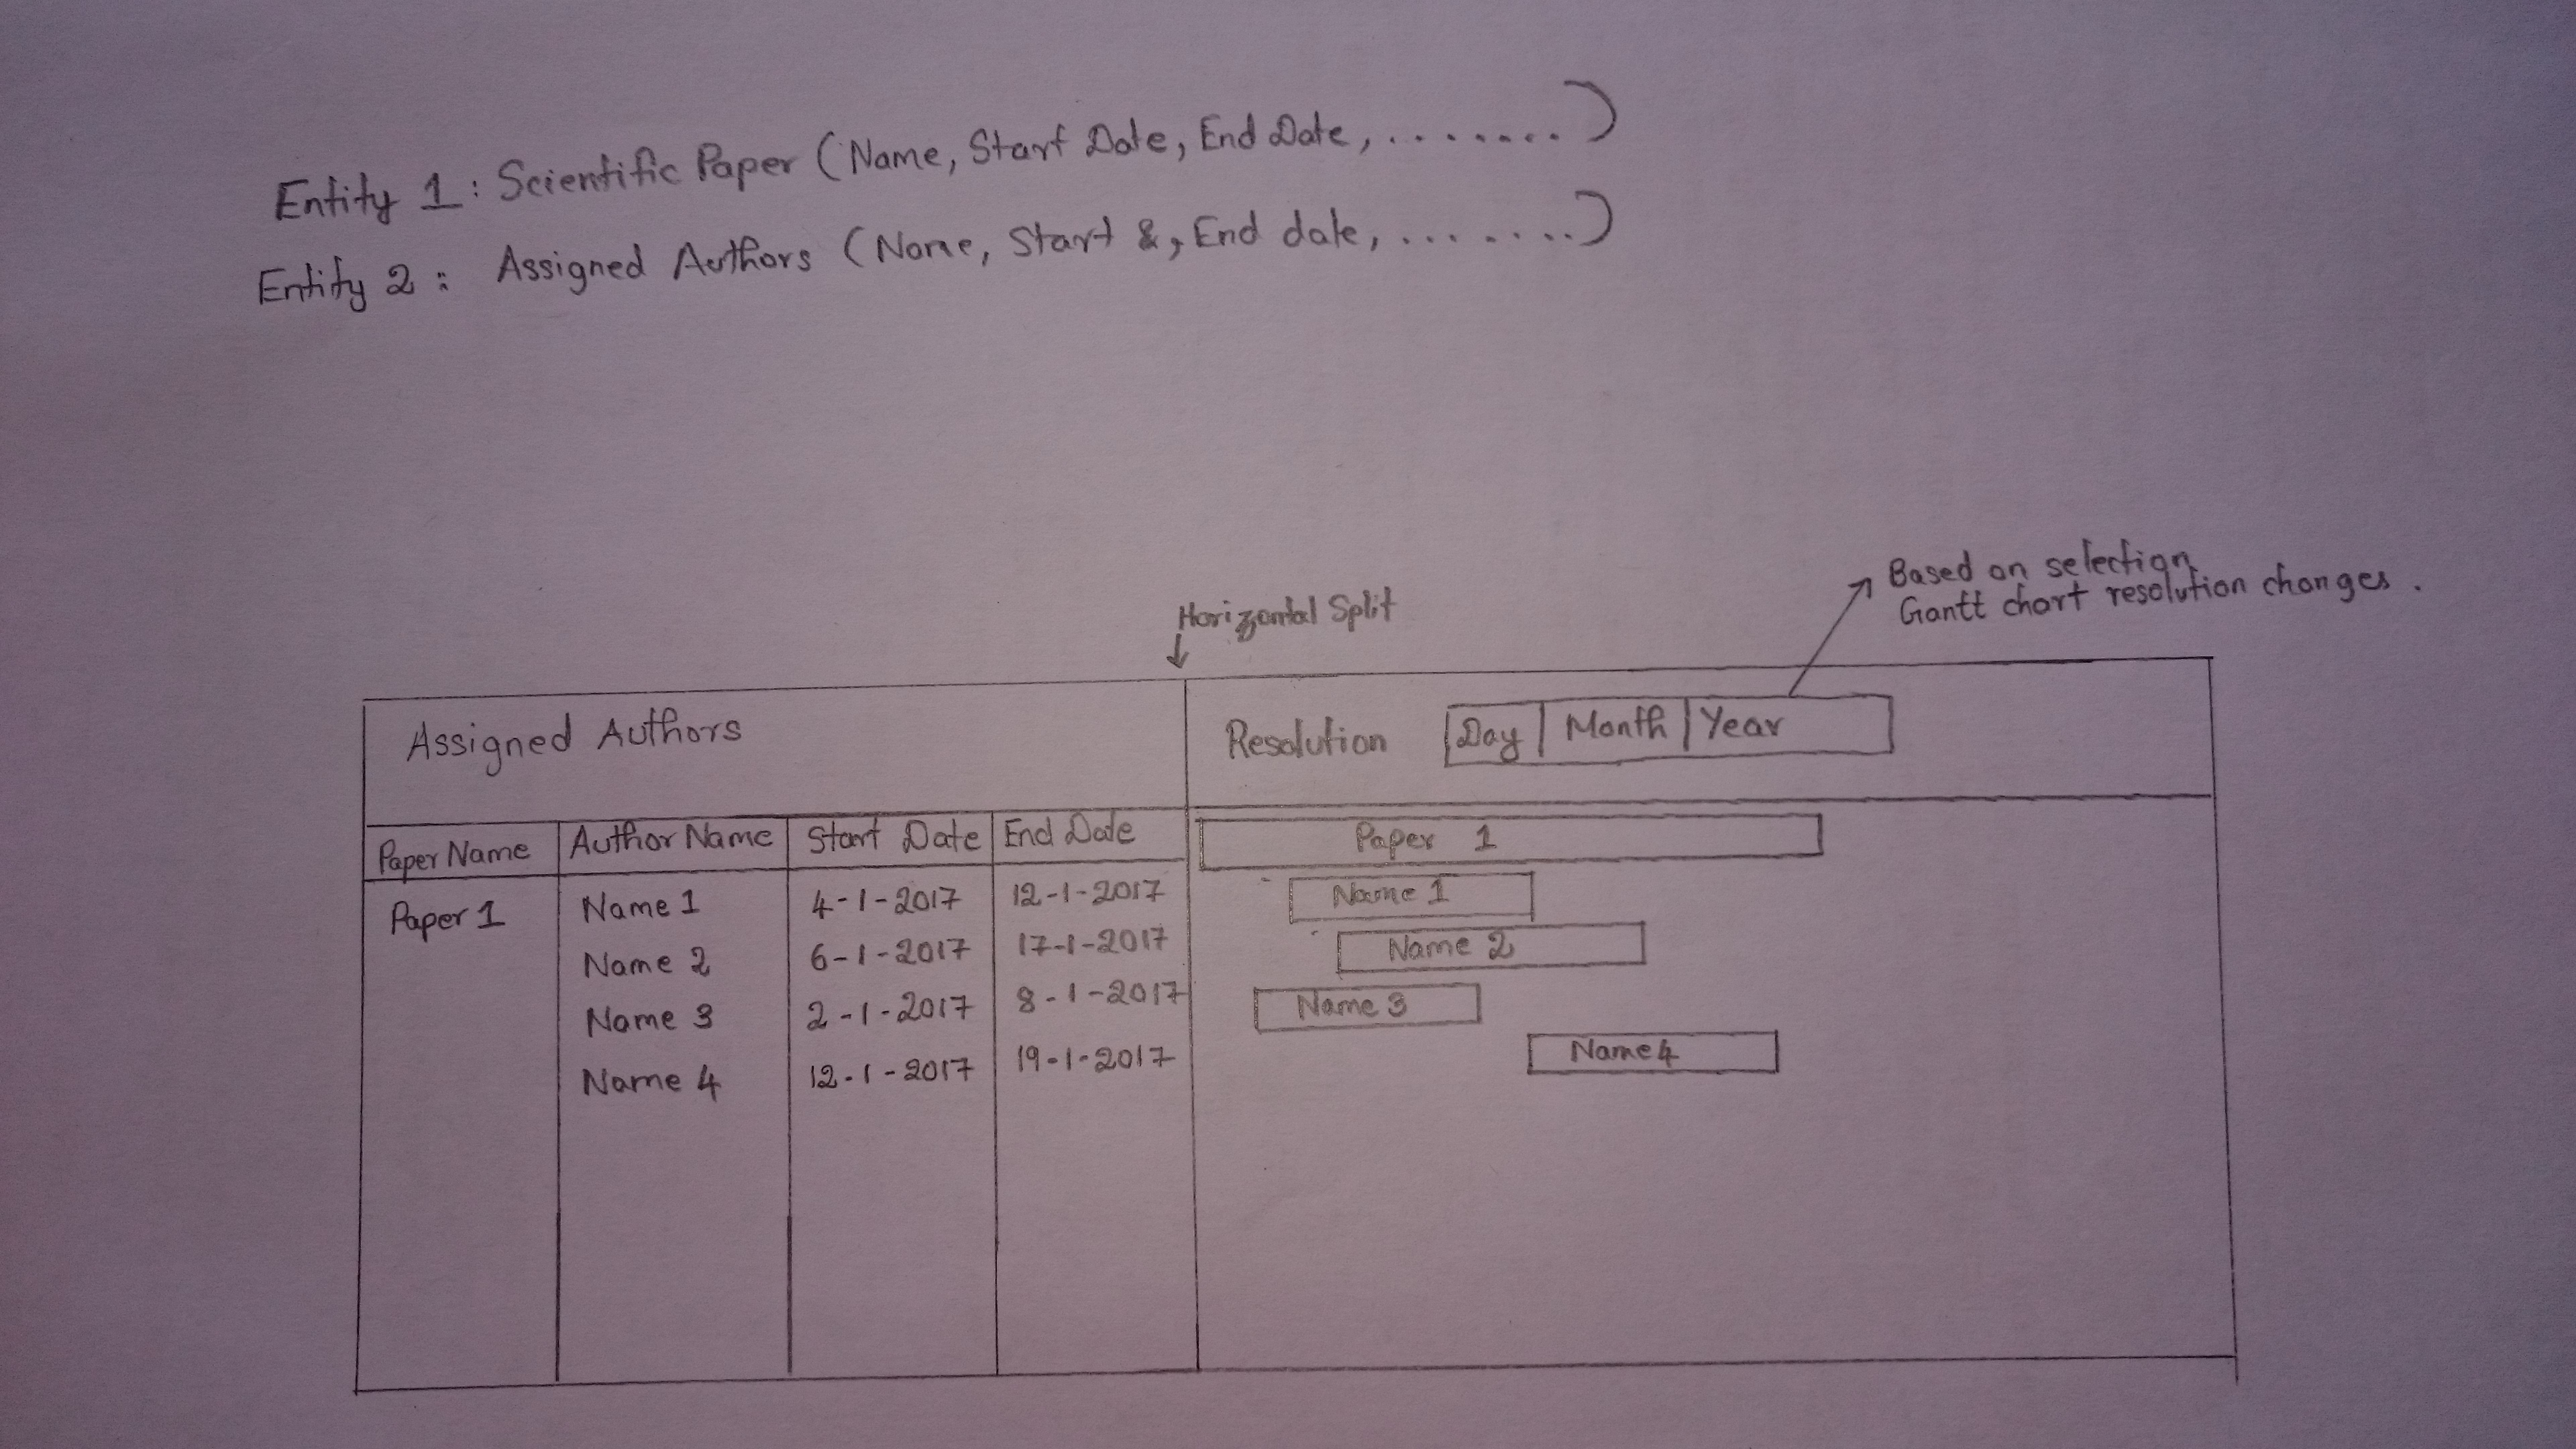
I would like a Horizontal Split Screen with table and gantt chart
On the Left Side:
A table which contains Scientific Paper Name, Assigned Authors Name, Assigned Authors Start Date and End Date.
On the Right Side:
A Gantt chart which shows the Data. Need to show Start and End Date of that particular Scientific Paper by id and the Start and End date of assigned list authors to that particular scientific paper by id.
Also I would like to know if we can use tabs to change gantt chart based on Week, Month and Year.
I am attaching a picture which I drew to show you What I want exactly?
I heard that I can show either Scientific Paper or Assigned Authors in a Gantt chart.
I would like to know if its possible to use both as shown in the picture.
There are three ways how you can pass data to a chart: through the DataProvider interface, using the data source mechanism, or the simplified data binding API, which allows adding the data directly using the addData() method and convenient MapDataItem constructors for those charts that are not bound to a data source.
The DataProvider interface has a standard implementation: ListDataProvider class. It contains a list of DataItem instances from which the data for the chart will be taken. There are several standard implementations of the DataItem interface:
EntityDataItem takes an instance of an entity ([url=https://demo.cuba-platform.com/sampler/open?screen=entity-data-item]live demo[/url]).
MapDataItem is a set of key-value pairs ([url=https://demo.cuba-platform.com/sampler/open?screen=map-data-item]live demo[/url]).
SimpleDataItem takes an instance of any public class ([url=https://demo.cuba-platform.com/sampler/open?screen=simple-data-item]live demo[/url]).
For instance, you can use DataProvider in combination with MapDataItem to construct custom data for a GanttChart which will include all required fields from both entities.
As for the periods of GanttChart (Week, Month and Year), the task is complex. For sure, you can use GanttChart#setPeriod to change period at runtime, but this property has no effect on a date-based chart because it’s used to represent numbers as values like hours, days, etc. (i.e. to change value axis scale). Also, changing the period property at runtime doesn’t convert values to another scale, only value axis labels will be changed. All these restrictions relate to AmCharts library which is used as Web representation of Charts. So, if you need different views of GanttChart like Week, Month and Year then you need to write custom logic for preparing data which relevant to a particular view. For switching between views you can use either OptionsGroup component (and have only one instance of GanttChart) or TabSheet component (and have individual instance for each view).
No, you cannot use several datasources at the same time with GanttChart. As I suggested before, you can combine data from several datasources using MapDataItems and pass it using DataProvider.
We have plans to create some kind of such sample, but I can’t promise any schedule.