Hi, I need to visualize a directed graph in my cuba platform project. I haven’t found much material to visualize a graph. Could you please help me? Is there an internal plugins?
thanks
Hello Bruno,
You can try to integrate an external java script library.
For example, there is a Vaadin add-on vizcomponent.
Hope this helps.
Thanks,
Ilya
hi,
how can integrate vizcomponent in cuba? have you an example for make it?
thank you for your support.
You can see the documentation on how to create custom visual components. In particular, there is a section on connecting a third-party vaadin component there.
Thanks.
Sorry, but i have many problem to create this project.
please, can you create an example. i have the cuba versione 7.2.23.
Thank you for your support
SORRY, but i am not able to add this add-on to cuba. please can you show me how add the library in build.gradle and in the file AppWidgetSet.gwt.xml. With stepper example is ok but with viz i have many problem.
thank you
Hello Bruno,
To add viz component you need to complete next steps:
-
Add dependency to
build.gradleinwebModule
compile('com.vaadin.pontus:vizcomponent:2.0') -
Create
web-toolkitmodule. Right-click onProject, selectManage modules, createWeb-toolkit module. -
Edit
AppWidgetSet.gwt.xml:
<module>
    <inherits name="com.haulmont.cuba.web.widgets.WidgetSet" />

    <inherits name="com.vaadin.pontus.vizcomponent.WidgetSet"/>
</module>
- Integrate
vizinto your screen. For example:
@UiController("screen")
@UiDescriptor("new-screen.xml")
public class NewScreen extends Screen {
@Inject
private VBoxLayout container;
@Subscribe
public void onInit(InitEvent event) {
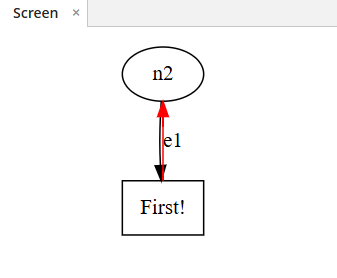
final VizComponent component = new VizComponent();
Graph.Node node1 = new Graph.Node("n1");
Graph.Node node2 = new Graph.Node("n2");
Graph graph = new Graph("G", Graph.DIGRAPH);
graph.addEdge(node1, node2);
graph.addEdge(node2, node1);
Graph.Edge edge1 = graph.getEdge(node1, node2);
edge1.setParam("color", "red");
node1.setParam("shape", "box");
node1.setParam("label", "\"First!\"");
edge1.setParam("label", "e1");
component.setWidth("300px");
component.setHeight("200px");
component.drawGraph(graph);
container.unwrap(Layout.class)
.addComponent(component);
}
}
Code example you can find here.
- Run app, open your screen and you’ll see viz component:
Thanks,
Ilya