Hi,
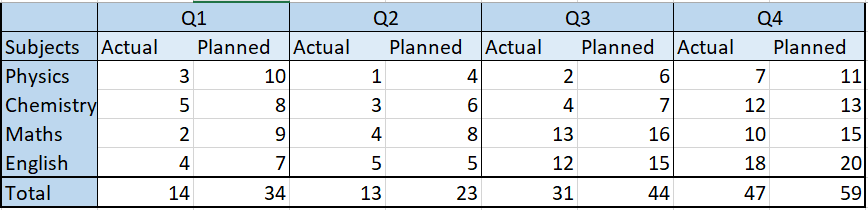
There are four quarters Q1,Q2,Q3 and Q4 and I need them to be segregated in two categories: Actual and Planned wherein Actual is the data that is being fetched through a query and planned is the data which I will set explicitly.
Also, I need the total row to be visible that calculates the sum of the given columns.
Could you clarify the entity structure? Does it contain both “Actual” and “Planned” attributes?
If yes, probably it cannot be implemented by PivotTable, because PivotTable configures columns under each other, e.g. “Planned” will be under “Actual” or vice versa (depends on the order in the PivotTable). In this case, I can suggest using DataGrid with header and footers. See online demo: datagrid-header-footer.