jkarippery
September 11, 2018, 12:44pm
#1
Hello,
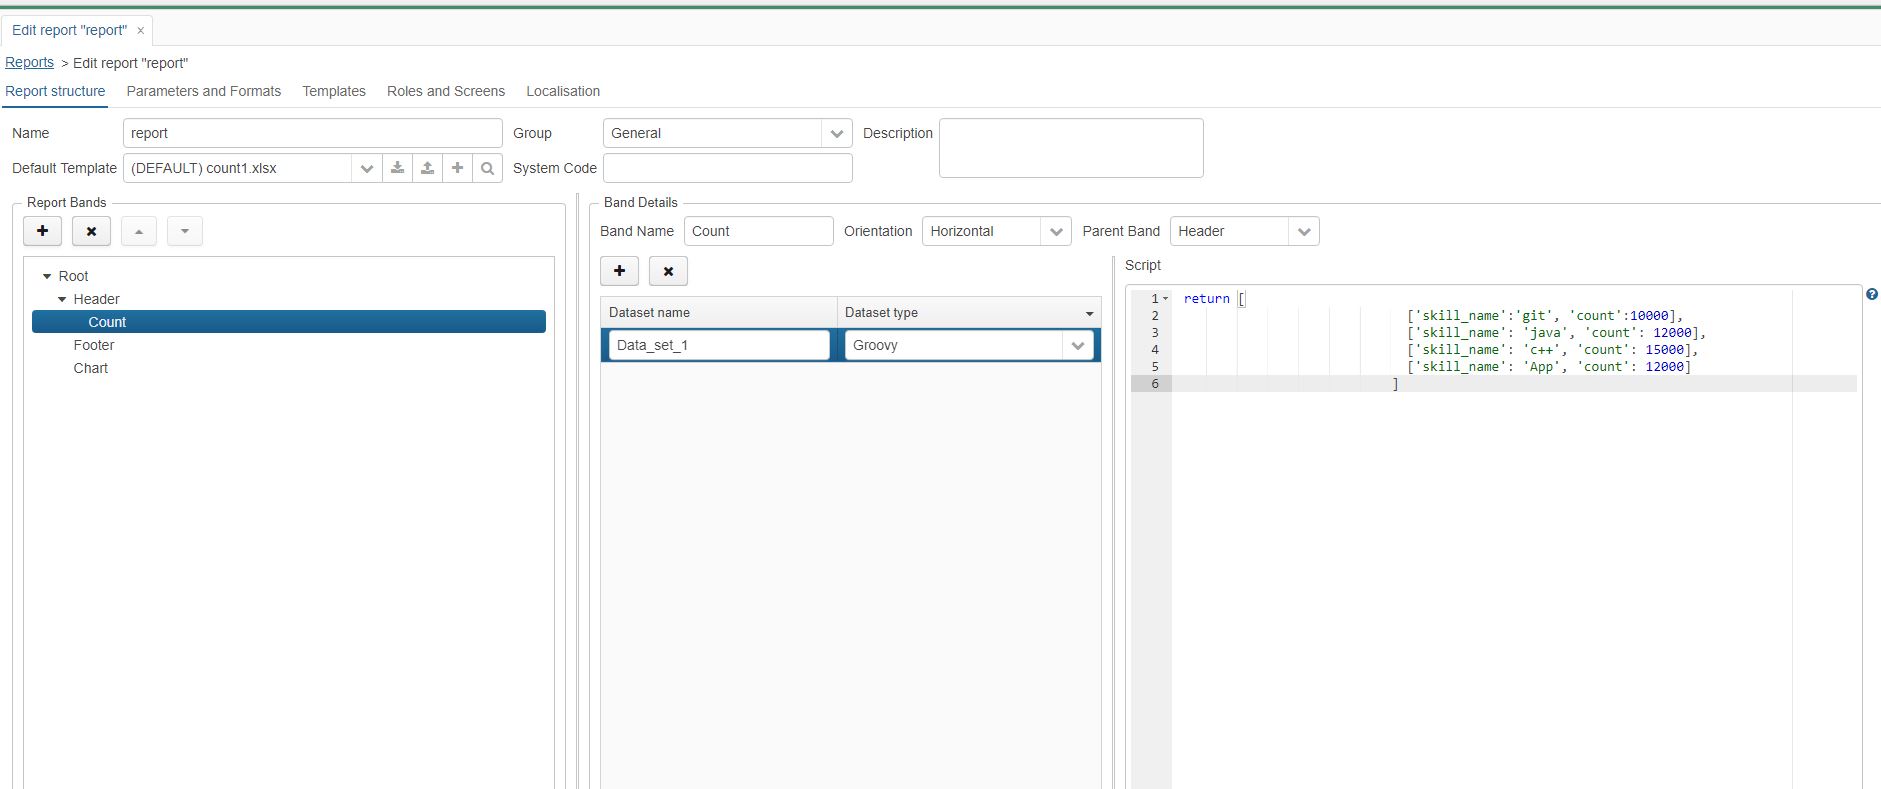
I would like to make a pie chart of all project name and time that project is using inside report.
Is that possible make a chart like that ? or can you make simple chart using this sample than i can understand the step to create report chart.
I know how to make chart out side report. I want to know what is the difference between them.
I read this documentation but still i didn’t get output ( Chart Template - CUBA Platform. Report Generator ).
subbotin
September 14, 2018, 7:16am
#3
Hello,
You can find more information about charts in the documentation: Xlsx Charts creation · cuba-platform/yarg Wiki · GitHub
Thank you,
jkarippery
September 19, 2018, 12:10pm
#5
Thank you… it was very helpful for me
jkarippery
September 20, 2018, 9:39am
#6
Hello,is that possible to do that?
thank you
subbotin
September 20, 2018, 9:59am
#7
1 Like
jkarippery
September 21, 2018, 10:31am
#8
Hello Andrey,
An error occurred while rendering band [Chart]. Template name [count1.xlsx] Report name [report]
Could you help me why this error happen?
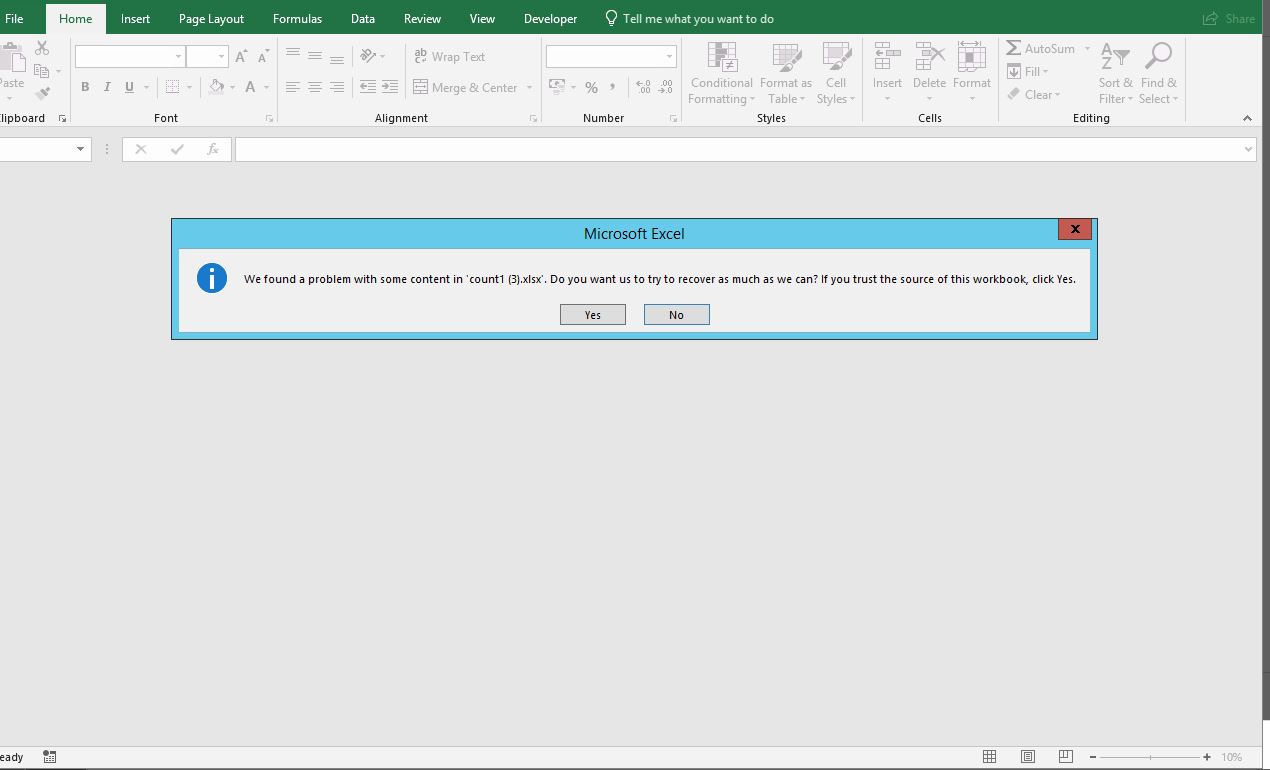
count1.xlsx (11.7 KB)
when I change Chart to Chat1(name of chart) and also I got error in Xmls file