Chalk theme do not appear well

Hi,

I saw in examples, samples and in the documentation, that there is an xml option:


theme="LIGHT"

But in cuba’s documentation I didn’t find more information how to use it. At amcharts I found a very pretty theme named ‘chalk’. I setted theme=“CHALK” and it worked fine, but I attached a picture what I can see on my webpage. I think I should make a dark background, but it is possible to make dark background only on my chart’s page? I wanted colorful columns like here

How to set that?

Thanks,
Carol

ChalkChart

Hi,

Unfortunately, I cannot reproduce the problem. Could you please provide a small sample project? Or at least screen descriptor/controller and which platform version do you use?

Regards,

Gleb

Hi Gleb,

Controller is empty, I created a datasource with a query.
The screen descriptor xml looks like:


<chart:serialChart id="testColumnChart"
                           autoMargins="false"
                           caption="msg://Személyek a rendszerben"
                           categoryField="rendszer"
                           datasource="SzemRendszerbenDs"
                           height="90%"
                           marginBottom="26"
                           marginLeft="30"
                           marginRight="8"
                           marginTop="10"
                           startDuration="1"
                           theme="CHALK"
                           width="90%">
            <chart:valueAxes>
                <chart:axis axisAlpha="0"
                            position="LEFT"
                            title="Személyek a rendszerben"/>
            </chart:valueAxes>
            <chart:balloon adjustBorderColor="false"
                           color="BLACK"
                           horizontalPadding="10"
                           verticalPadding="8"/>
            <chart:graphs>
                <chart:graph alphaField="alpha"
                             balloonText="&lt;span style=&apos;font-size:12px;&apos;&gt;[[title]] in [[rendszer]]:&lt;br&gt;                              &lt;span style=&apos;font-size:20px;&apos;&gt;[[value]]&lt;/span&gt; [[additional]]&lt;/span&gt;"
                             dashLengthField="dashLengthColumn"
                             fillAlphas="0.9"
                             lineAlpha="0.2"
                             title="Személy"
                             type="COLUMN"
                             valueField="count"/>
            </chart:graphs>
            <chart:export/>
        </chart:serialChart>

I could make a black background! I gave the screen’s layout a new style name ‘chartLayout’, and I wrote to my scss:


.chartLayout{
         background-color: black;
}

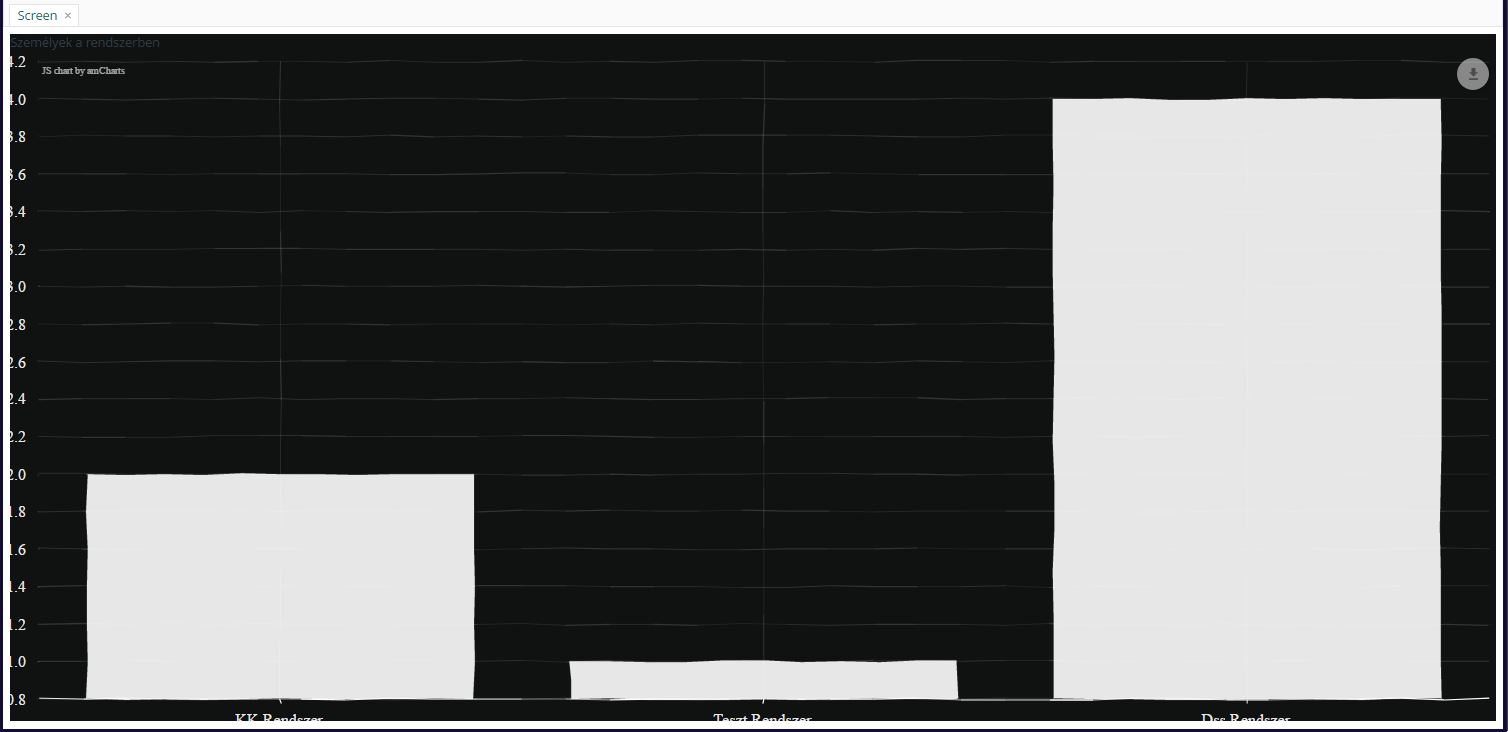
And now it works, the only problem is that how the texts next to the chart overflow. I attached a picture about it.
But I have no idea for the colorful columns. At amchart they give one by one the colors.
And it has a white border, which looks ugly :confused:

So could you help me find a solution for full black background, overflow text and colorful columns at chart?

Thank you so much!

ChalkChartBlackBackground

I have the following suggestions:

  • Set lineAlpha=“0” attribute inside graph element to remove columns border
  • Increase values of marginBottom and marginLeft attributes of serialChart element to fix layout overflow issue
  • Set gridAlpha=“0” attribute inside axis and categoryAxis elements to remove grid lines and achieve pure black background.

Regards,

Gleb

Thank you so much!

How to set one color to all columns?
And do you know any solution for colorful, like rainbow column coloring?
And can I edit somehow the Chart’s font-family and color? I tried with scss, but it didn’t work as with the background.

The graph element has the lineColor attribute which can be used to set a color for all columns of a certain graph, e.g. lineColor=“VIOLET”. To set different colors for columns you need to specify the colorField for a graph or chart (e.g. see the gantt chart sample).

Regards,

Gleb