Bad performance when loading data through several related entities.

Hi CUBA team,

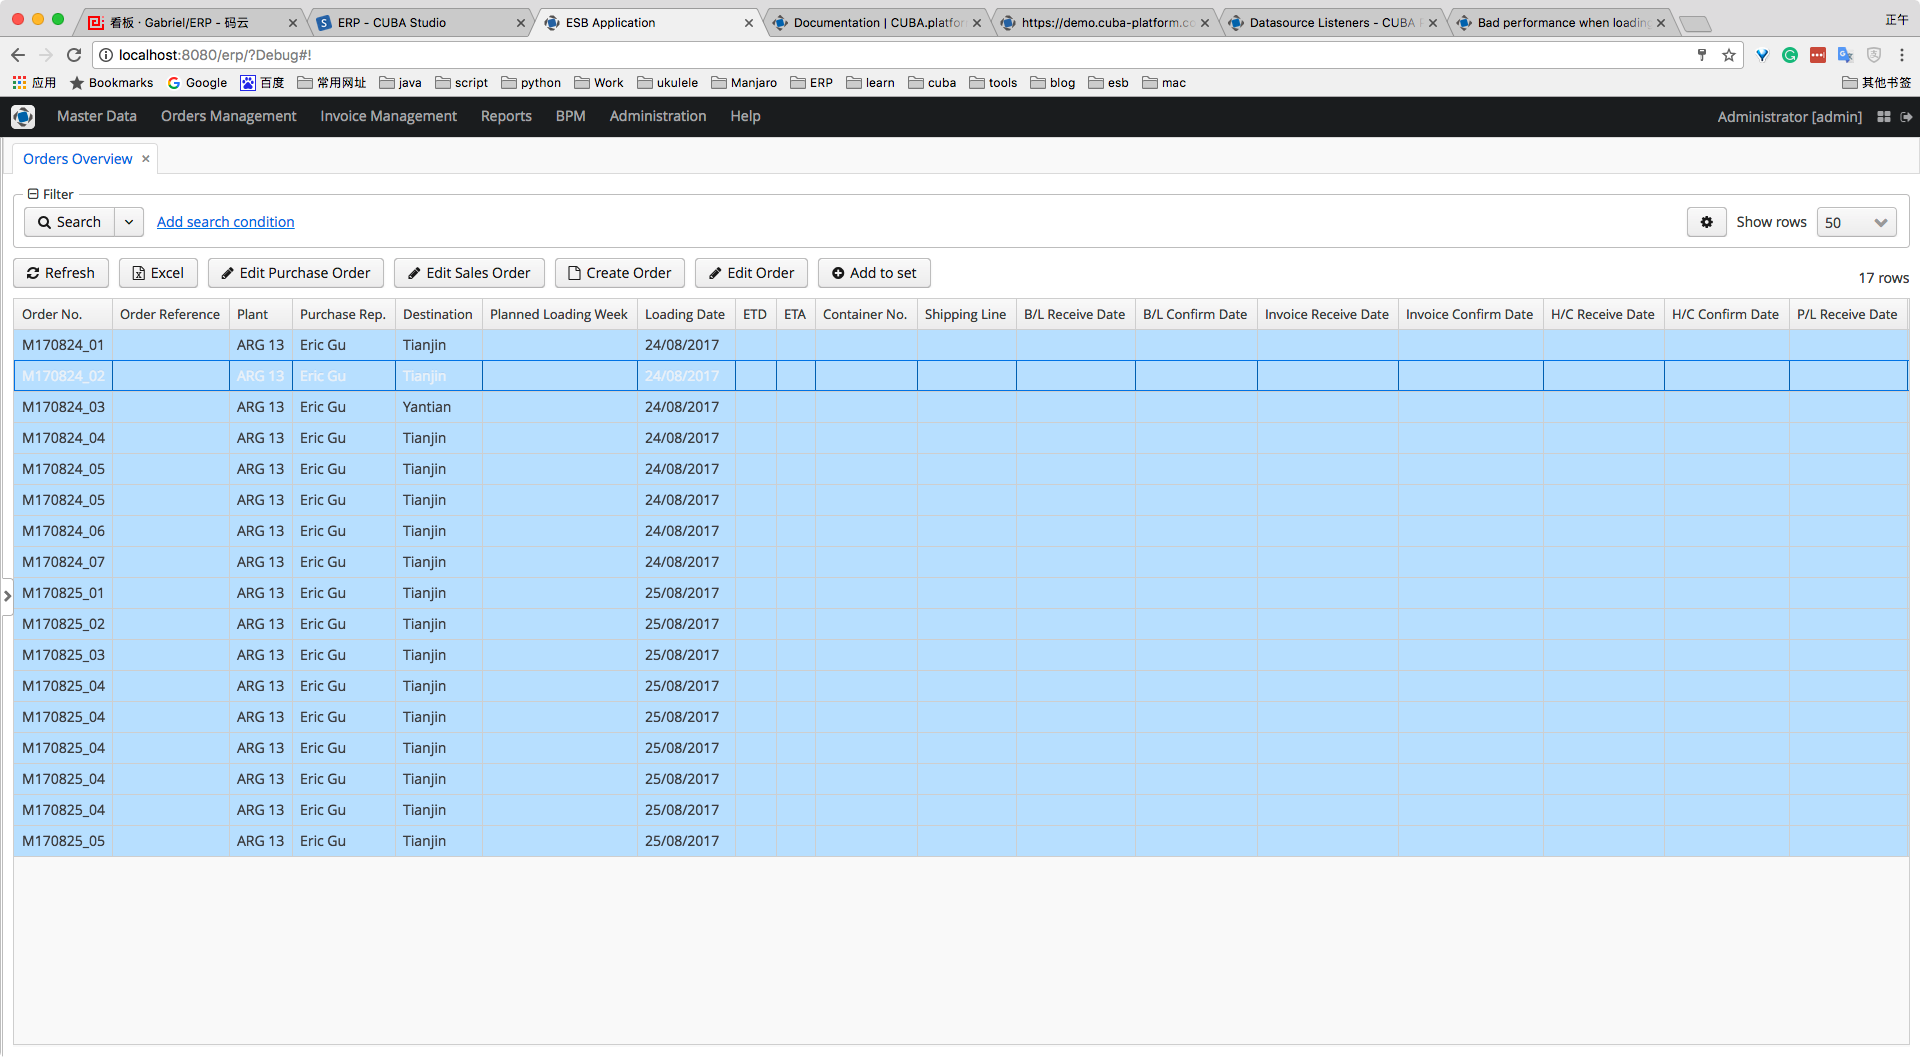
I have a requirement that to display an overview that contains some information on several related entities.

simply, I created an entity view that contains all the information I need and display them in a table.


<view class="com.esb.erp.entity.oi.PurchaseOrderLine"
          extends="_local"
          name="purchaseOrderLine-overview">
        <property name="purchaseOrder"
                  view="_minimal">
            <property name="representative"
                      view="_minimal"/>
            <property name="plant"
                      view="_minimal"/>
            <property name="port"
                      view="_minimal"/>
            <property name="containerNo"/>
            <property name="shippingLine"
                      view="_minimal"/>
            <property name="loadingDate"/>
            <property name="etd"/>
            <property name="eta"/>
            <property name="orderReference"/>
            <property name="deliveryNote"/>
            <property name="remark"/>
            <property name="grossAmount"/>
            <property name="invoiceAmount"/>
            <property name="currency"
                      view="_minimal"/>
            <property name="blReceiveDate"/>
            <property name="blConfirmDate"/>
            <property name="invoiceReceiveDate"/>
            <property name="invoiceConfirmDate"/>
            <property name="hcReceiveDate"/>
            <property name="hcConfirmDate"/>
            <property name="plReceiveDate"/>
            <property name="plConfirmDate"/>
            <property name="coReceiveDate"/>
            <property name="coConfirmDate"/>
            <property name="paymentTerm"
                      view="_minimal">
                <property name="prepay"/>
            </property>
            <property name="docsReceiveDate"/>
            <property name="docsConfirmDate"/>
            <property name="supplier"
                      view="_minimal"/>
            <property name="createTs"/>
            <property name="createdBy"/>
        </property>
        <property name="product"
                  view="_minimal"/>
        <property name="salesOrderLine">
            <property name="salesOrder"
                      view="_minimal">
                <property name="customer"
                          view="_minimal"/>
                <property name="paymentTerm"
                          view="_minimal"/>
                <property name="thirdParty"
                          view="_minimal"/>
                <property name="grossAmount"/>
                <property name="remark"/>
                <property name="representative"
                          view="_minimal"/>
                <property name="currency"
                          view="_minimal"/>
            </property>
            <property name="price"/>
            <property name="salesInvoice"
                      view="_minimal">
                <property name="prepayExpectedAmount"/>
                <property name="prepayPaidAmount"/>
                <property name="prepayPaidDate"/>
                <property name="balanceExpectedAmount"/>
                <property name="balancePaidAmount"/>
                <property name="balancePaidDate"/>
                <property name="prepayAmount"/>
                <property name="balanceAmount"/>
                <property name="remark"/>
                <property name="status"/>
            </property>
        </property>
        <property name="orderedAmount"/>
        <property name="purchaseInvoice"
                  view="_minimal">
            <property name="prepayExpectedAmount"/>
            <property name="prepayPaidAmount"/>
            <property name="prepayPaidDate"/>
            <property name="balanceExpectedAmount"/>
            <property name="balancePaidAmount"/>
            <property name="balancePaidDate"/>
            <property name="prepayAmount"/>
            <property name="balanceAmount"/>
            <property name="remark"/>
            <property name="status"/>
        </property>
        <property name="uom"
                  view="_minimal"/>
        <property name="productAlias"
                  view="_minimal">
            <property name="nameChn"/>
        </property>
        <property name="createTs"/>
        <property name="createdBy"/>
        <property name="updateTs"/>
        <property name="updatedBy"/>
    </view>

I also added the style to separate the information of purchase and sales.

the performance seems not good. It will take about 6 seconds to display about 60 rows.

I am not sure if I made any mistake? Any suggestions on this?

I want to try to use a database view to display this overview data. but I am not sure how to bundle the view data to a nonpersistent entity. And I am not sure if it can solve the performance issue.

Best Regards.
Gabriel.

Hi Gabriel,

First of all, identify all collections in the view. If there are any, try to manually set BATCH fetch mode for them. Or remove them from the view at all, because depending on how you want to represent the data, collections can usually be loaded by separate requests or standalone datasources linked to the master one.

Also, analyze SQL executed on the database: set DEBUG level for “eclipselink.sql” logger and see tomcat/logs/app.log. Make sure you have indexes for join columns.

1 Like

Hi Konstantin,

Thank you very much for your advice. I have tried that, and I have run the SQL in the database.

[2017-08-28 17:07:54] 50 rows retrieved starting from 1 in 317ms (execution: 95ms, fetching: 222ms)

It is not the SQL problem.

how can I identify the time spent on rendering the table?

because I have some non-persistent fields in some of the entities. and I have set a style provider to the table.

I am not sure where the time has been costed.

Best Regards.
Gabriel

You can easily find out how much time the request took on the server side and on the browser side. Add ?debug parameter to the app URL, e.g. http://localhost:8080/app/?debug, and you will see the Vaadin console. Clear it and perform the request (open a screen or press a button). The console will show something like this:

62088ms	RPC invocations to be sent to the server:
62088ms	   3293641434249264786 (class com.haulmont.cuba.web.toolkit.ui.client.button.CubaButtonConnector) :
62089ms	      com.vaadin.shared.ui.button.ButtonServerRpc.click([LEFT,68,130,false,false,false,false,1,47,20])
62089ms	Sending xhr message to server: {"rpc":[["3293641434249264786","com.vaadin.shared.ui.button.ButtonServerRpc","click",[{"altKey":false,"button":"LEFT","clientX":68,"clientY":130,"ctrlKey":false,"metaKey":false,"relativeX":47,"relativeY":20,"shiftKey":false,"type":1}]]],"syncId":12,"clientId":11}
62116ms	Server visit took 26.245ms
62116ms	JSON parsing took 0.15ms
...
62159ms	Processing time was 42ms

See “Server visit took 26.245ms” and “Processing time was 42ms” messages.

Hi Konstantin,

Thank you, but I have to disturb you again, sorry.

By using the method you told. I found the most time cost:

Tue Aug 29 10:49:41 GMT+800 2017 com.vaadin.client.communication.MessageHandler
INFO: * Unregistered 52 connectors
com.haulmont.charts.web.toolkit.ui.ChartsWidgetSet-0.js:9099 Tue Aug 29 10:49:41 GMT+800 2017 com.vaadin.client.communication.MessageHandler
INFO: handleUIDLMessage: 1403 ms
Tue Aug 29 10:49:41 GMT+800 2017 com.vaadin.client.communication.MessageHandler
INFO:  Processing time was 1442ms
com.haulmont.charts.web.toolkit.ui.ChartsWidgetSet-0.js:9099 Tue Aug 29 10:49:41 GMT+800 2017 com.vaadin.client.communication.MessageHandler
INFO: Referenced paintables: 109

But I am not sure what is that means. This MessageHandler takes about 3 seconds.

Best Regards.
Gabriel

Hi Konstantin,
At first, I used Date Grid to present the data. now I have changed it to Table. and now I don’t have the performance issue. I think the Data Grid has the performance issue.
I add a style provider to the table, but there is little problem. PFA.
the scss is:

.v-table-cell-content.purchase {
  background-color: #C6E2FF;
}
.v-table-cell-content.sales {
  background-color: #FFF0F5;
}

when a row is select, it is not marked as blue.

WX20170829-171912

Could you please create a separate topic on this?

1 Like

Hi Konstantin,

The problem is solved. Thank you very much for your kind help.

Best Regards.
Gabriel.